Chapter 2: To give one thing in exchange for another

A game where players exchange goods, practice how they make them, get better, and tax each other……time.
Helpers for reading a run
drought_layer <- function(players) {
  geom_rect(
    data = players |> filter(!is.na(drought_good)) |> distinct(day),
    inherit.aes = FALSE,
    aes(xmin = day - 0.5, xmax = day + 0.5, ymin = -Inf, ymax = Inf),
    fill = alpha(palette$ink, 0.15)
  )
}

plot_status <- function(players, title, subtitle) {
  players |>
    count(day, status) |>
    mutate(
      share  = n / sum(n),
      status = factor(status, levels = c("trading", "alone", "short"),
                      labels = c("Trading", "Alone", "Short day")),
      .by    = day
    ) |>
    ggplot(aes(x = day, y = share, fill = status)) +
    geom_area() +
    scale_fill_manual(values = c(Trading     = palette$ink,
                                 Alone       = alpha(palette$ink, 0.45),
                                 `Short day` = alpha(palette$ink, 0.15))) +
    labs(title = title, subtitle = subtitle, x = "Day", y = "Share of players", fill = NULL) +
    theme_bmh()
}

plot_choices <- function(players, title, subtitle) {
  goods <- sort(setdiff(unique(players$choice), "none"))

  players |>
    count(day, choice) |>
    complete(day, choice = c(goods, "none"), fill = list(n = 0)) |>
    mutate(choice = factor(choice, levels = c(goods, "none"),
                           labels = c(paste("Good", goods), "No specialty"))) |>
    ggplot(aes(x = day, y = n)) +
    drought_layer(players) +
    geom_area(fill = alpha(palette$ink, 0.3)) +
    geom_line(linewidth = 0.5) +
    facet_wrap(~ choice, ncol = 3) +
    labs(title = title, subtitle = subtitle, x = "Day", y = "Players") +
    theme_bmh()
}

plot_village <- function(players, summary, title, subtitle, y) {
  players |>
    summarise(value = {{ summary }}, .by = day) |>
    ggplot(aes(x = day, y = value)) +
    drought_layer(players) +
    geom_line() +
    labs(title = title, subtitle = subtitle, x = "Day", y = y) +
    theme_bmh()
}

plot_members <- function(players, summary, title, subtitle, y) {
  players |>
    summarise(value = {{ summary }}, .by = c(day, member)) |>
    ggplot(aes(x = day, y = value, linetype = member)) +
    drought_layer(players) +
    geom_line() +
    scale_linetype_manual(values = c(`In a group` = "solid", `Outside a group` = "dashed")) +
    labs(title = title, subtitle = subtitle, x = "Day", y = y, linetype = NULL) +
    theme_bmh()
}

# how each player got each good: one tile per player and good
plot_swaps <- function(choice, inside = NULL, outside = NULL, title, subtitle) {
  n_goods <- max(ncol(inside), ncol(outside))
  none    <- matrix(FALSE, length(choice), n_goods)
  inside  <- inside  %||% none
  outside <- outside %||% none
  fills   <- c(`Their own good`        = palette$ink,
               `Swapped in the group`  = alpha(palette$ink, 0.7),
               `Swapped on the market` = alpha(palette$ink, 0.4),
               `Made themselves`       = alpha(palette$ink, 0.1))

  expand_grid(player = seq_along(choice), good = seq_len(n_goods)) |>
    mutate(
      how = case_when(
        good == choice[player]       ~ "Their own good",
        inside[cbind(player, good)]  ~ "Swapped in the group",
        outside[cbind(player, good)] ~ "Swapped on the market",
        .default                     = "Made themselves"
      ),
      how    = factor(how, levels = names(fills)),
      good   = LETTERS[good],
      player = factor(player, levels = rev(seq_along(choice)))
    ) |>
    ggplot(aes(x = good, y = player, fill = how)) +
    geom_tile(colour = palette$paper, linewidth = 1.5) +
    scale_fill_manual(values = fills, drop = FALSE) +
    labs(title = title, subtitle = subtitle, x = "Good", y = "Player", fill = NULL) +
    guides(fill = guide_legend(nrow = 2)) +
    theme_bmh() 
}
One player, then two

  • (to restore: needs, efficiency, production, and why trade pays for two players)

The village

  • 100 players, 8 goods, a day of 12 hours
  • Every player needs one unit of every good, every day
  • Efficiency: units a player makes per hour; it differs by player and by good
  • Goods are swapped one for one; no prices, no money
  • Hours left after covering the day’s needs are free hours, the measure of how well a player does
  • Two costs run through the whole post: a swap takes a quarter of an hour, and groups charge their members dues
Show the code
base <- list(
  world  = list(need = 1),
  skills = list(forget = 0.002, floor_share = 0.5, e_max = 2, e_min = 0.5),
  market = list(swap_cost = 0.25, swap_cost_group = 0.2),
  invention = list(p = 0.0001, advantage = 3),
  groups = list(beta = 0, dues = 0.2, found = 0.01, found_every = 10)
)

dry <- list(on = TRUE, p = 0.003)

# the same base in every run; a section only names what it adds
story <- function(...) do.call(set_rules, modifyList(base, list(...)))

rules   <- story()
village <- new_village(n_players = 100, n_goods = 9, seed = 3)

1. Deciding what to make

What we simulate

  • Each player compares the hours every option would cost: specialise in one good and swap for the rest, or make everything alone
  • They take the cheapest option
  • Specialising only pays if partners exist: the chance of a swap depends on how many players make the other good

Example

  • A player makes 2 units of A per hour and half a unit of B per hour
  • Alone: half an hour for A, 2 hours for B, so 2.5 hours
  • Specialising in A: one hour for two units of A, one swapped for B, plus a quarter of an hour for the swap, so 1.25 hours
  • If only half the makers of A find a partner, the expected cost rises to about 1.9 hours; still better than alone
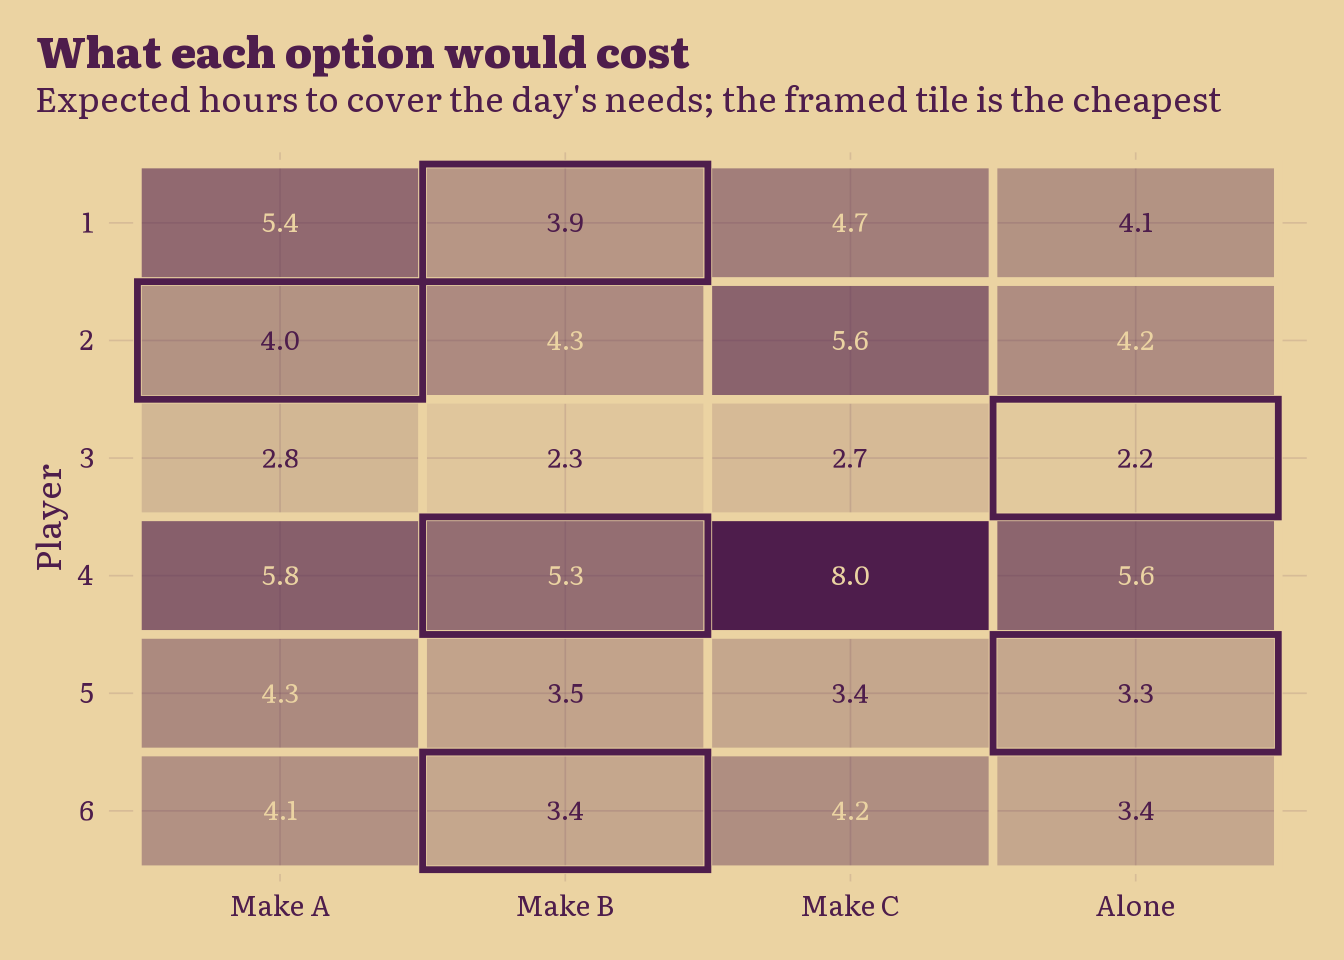
  • Below: six players, three goods, random efficiencies, and what each option would cost them on day one
Show the code
toy <- new_village(n_players = 6, n_goods = 3, seed = 2) |> set_unit_hours(rules)

option_costs(toy$today$unit_hours,
             swap_chances(toy$players$choice, n_goods = 3),
             swap_cost = rules$market$swap_cost) |>
  as_tibble() |>
  mutate(player = row_number()) |>
  pivot_longer(-player, names_to = "option", values_to = "hours") |>
  mutate(
    best   = hours == min(hours),
    option = factor(option, levels = c("A", "B", "C", "alone"),
                    labels = c("Make A", "Make B", "Make C", "Alone")),
    player = factor(player, levels = 6:1),
    .by    = player
  ) |>
  ggplot(aes(x = option, y = player)) +
  geom_tile(aes(fill = hours), colour = palette$paper, linewidth = 1.5) +
  geom_tile(data = \(d) filter(d, best), fill = NA, colour = palette$ink, linewidth = 1.2) +
  geom_text(aes(label = sprintf("%.1f", hours),
                colour = hours > median(hours)), family = "literata", size = 3.6) +
  scale_fill_gradient(low = alpha(palette$ink, 0.05), high = palette$ink, guide = "none") +
  scale_colour_manual(values = c(`TRUE` = palette$paper, `FALSE` = palette$ink), guide = "none") +
  labs(
    title    = "What each option would cost",
    subtitle = "Expected hours to cover the day's needs; the framed tile is the cheapest",
    x        = NULL,
    y        = "Player"
  ) +
  theme_bmh() +
  theme(panel.grid = element_blank())

  • How to read it: each row is a player; compare the framed tile with the “Alone” column to see how much specialising saves them

2. The market

What we simulate

  • Makers of A who want B meet makers of B who want A, and swap one for one
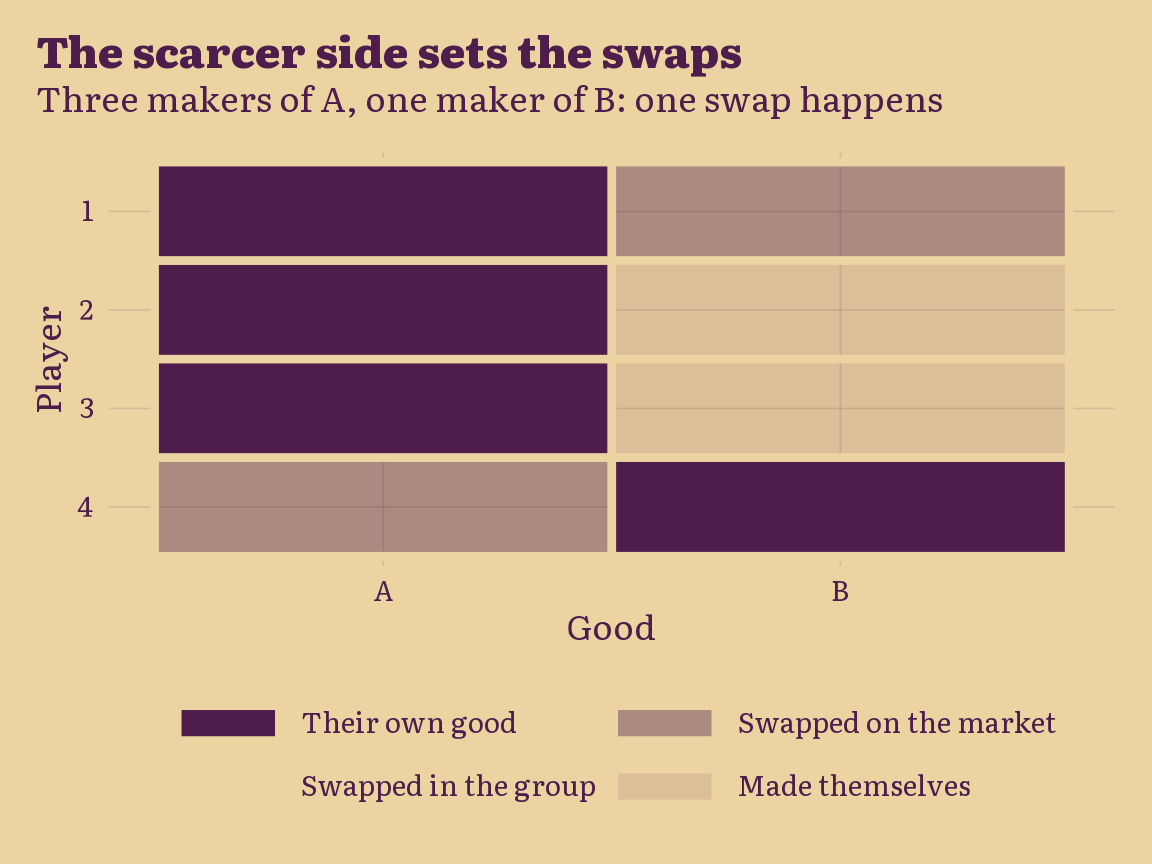
  • The scarcer side sets how many swaps happen; whoever finds no partner makes the good themselves
  • Each day, one player in five reconsiders what to make (player$revise)

Example

  • Three players make A, one makes B
  • Only one swap can happen: one A-maker gets a B, the other two make B themselves
Show the code
choice <- c(1, 1, 1, 2)
wants  <- rbind(c(FALSE, TRUE), c(FALSE, TRUE), c(FALSE, TRUE), c(TRUE, FALSE))

matched <- withr::with_seed(1, match_round(choice, wants, segment = rep(1, 4)))

plot_swaps(choice, outside = matched,
           title    = "The scarcer side sets the swaps",
           subtitle = "Three makers of A, one maker of B: one swap happens")

The run

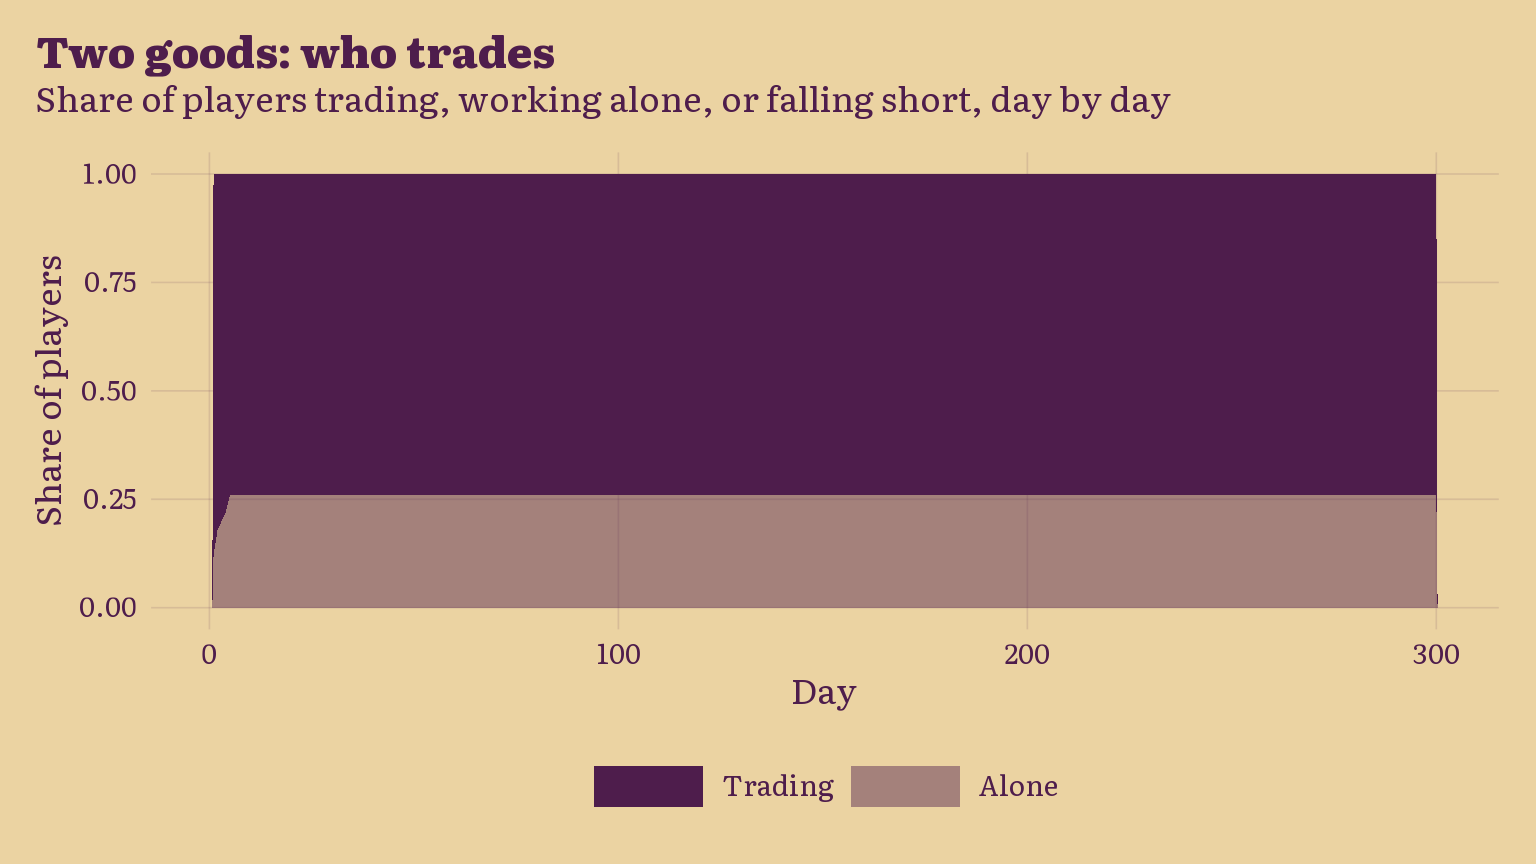
  • 100 players for 300 days, first with two goods, then with eight
Show the code
two_goods <- run_village(new_village(n_players = 100, n_goods = 2, seed = 3),
                         n_days = 300, rules = story())
calm      <- run_village(village, n_days = 300, rules = story())
Show the code
plot_status(two_goods$players,
            title    = "Two goods: who trades",
            subtitle = "Share of players trading, working alone, or falling short, day by day")

  • How to read it: the dark area is the share of players who swapped that day; look at how fast it settles and where
Show the code
plot_choices(calm$players,
             title    = "Eight goods: what the village makes",
             subtitle = "Number of players specialising in each good, day by day")

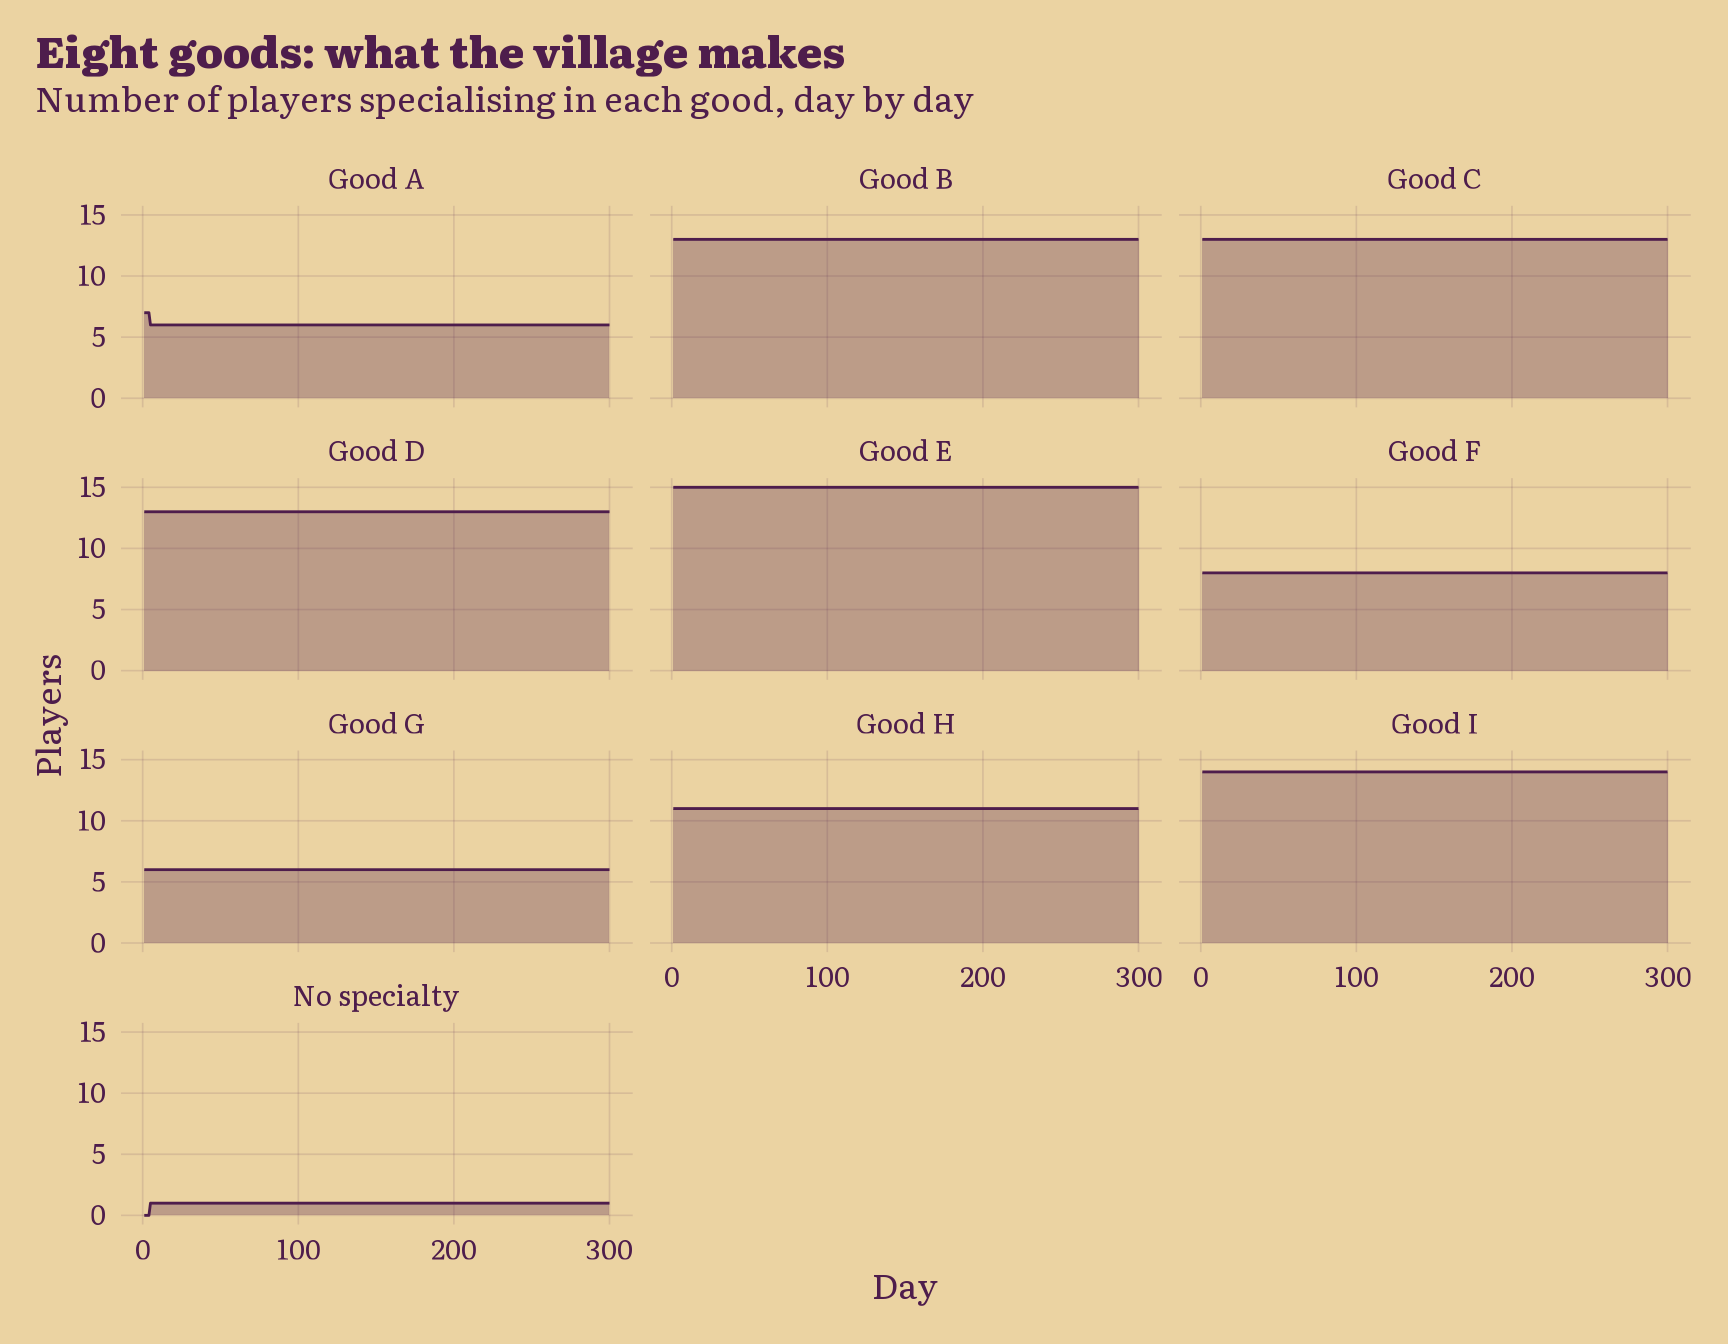
  • How to read it: with one-for-one swaps the village works best when every good has about the same number of makers; look at whether the panels move towards each other

3. Skills

What we simulate

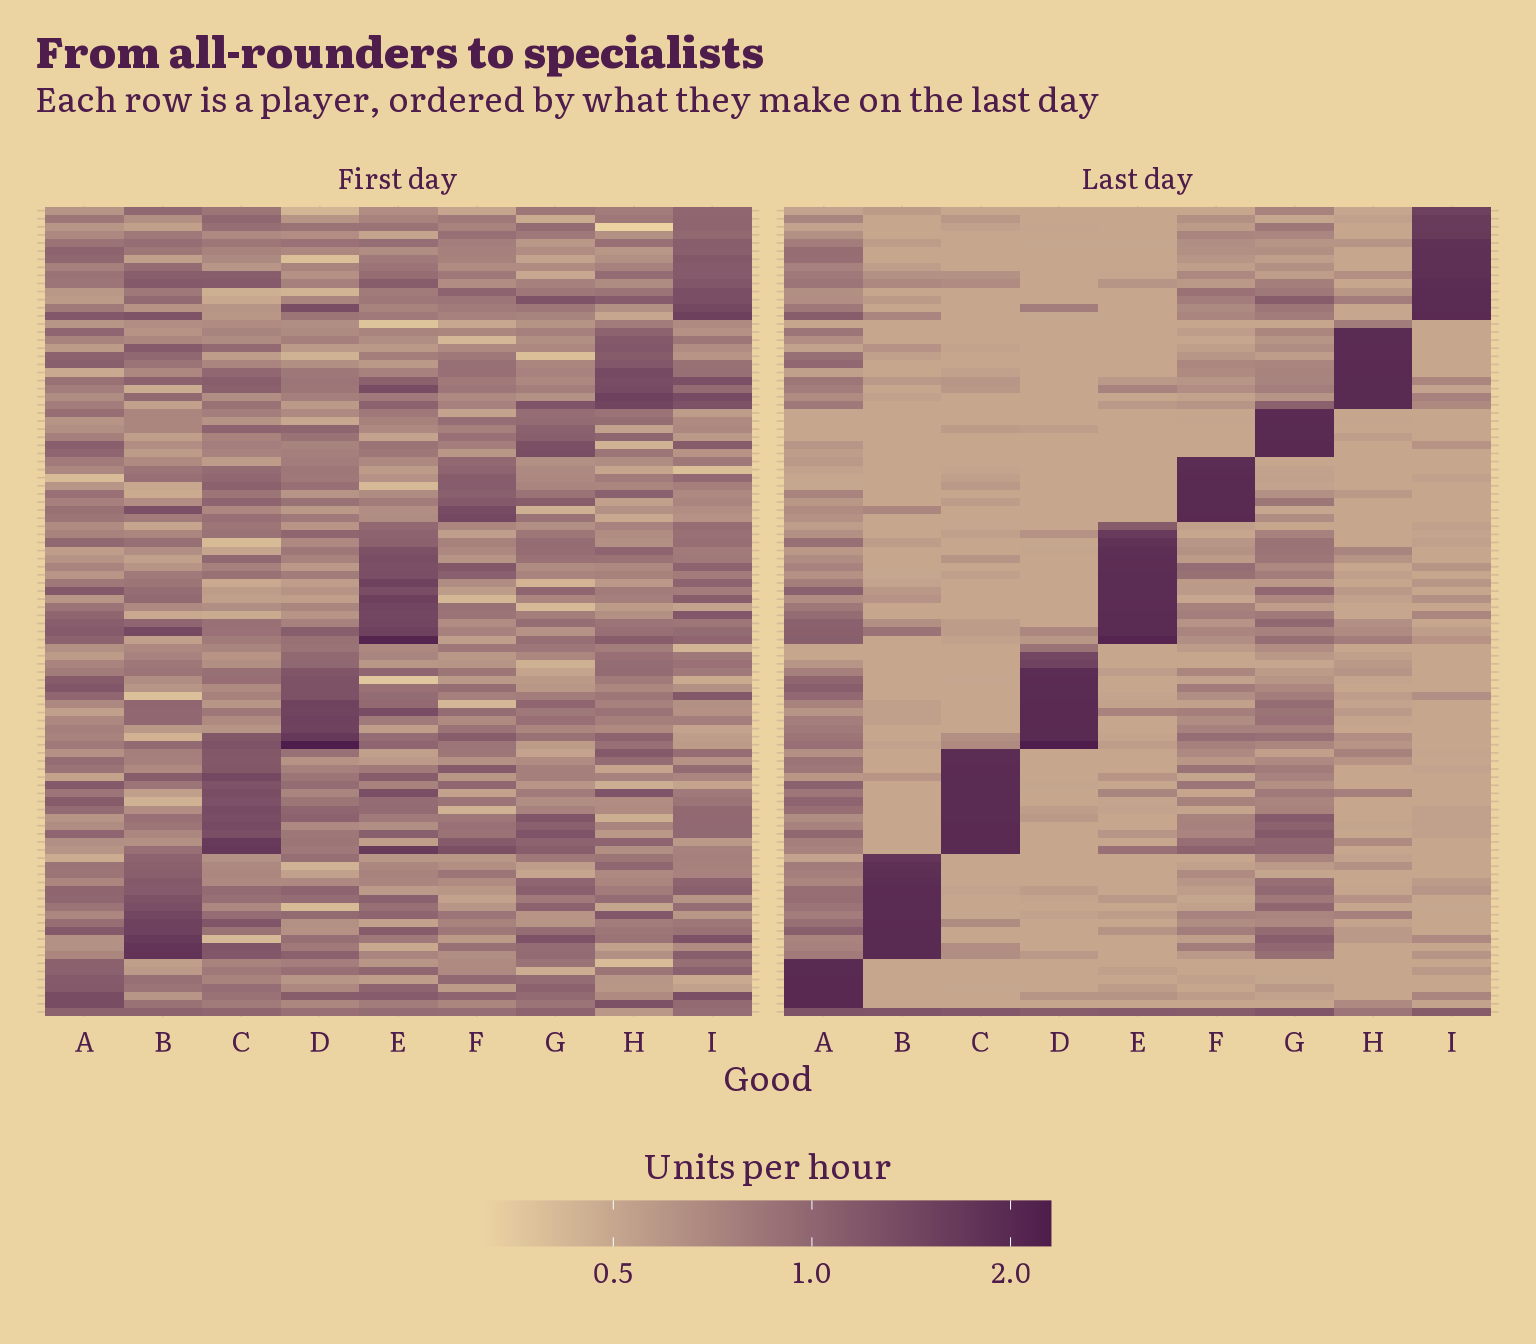
  • Free hours go into practice, split across the goods a player worked on that day
  • Practice raises efficiency, less and less as it nears a ceiling of 2 units per hour
  • A good a player stops making fades slowly, and never below half of where it started

Example

  • A player at 1 unit per hour puts 6 free hours into their good: efficiency grows about 1.25% that day
  • At 1.8 units per hour the same 6 hours give about 0.25%
  • A skill left unused loses 0.2% a day: about a tenth after 50 days, about half after a year

The run

  • Same run as above (calm); no new rule, we only look at efficiencies
Show the code
skills <- function(v) {
  as_tibble(v$players$eff) |>
    mutate(player = row_number()) |>
    pivot_longer(-player, names_to = "good", values_to = "efficiency")
}

player_order <- tibble(
  player = seq_along(calm$end$players$choice),
  choice = calm$end$players$choice,
  top    = apply(calm$end$players$eff, 1, max)
) |>
  arrange(choice, desc(top)) |>
  pull(player)

bind_rows(`First day` = skills(calm$start), `Last day` = skills(calm$end), .id = "when") |>
  mutate(player = factor(player, levels = player_order)) |>
  ggplot(aes(x = good, y = player, fill = efficiency)) +
  geom_tile() +
  facet_wrap(~ when) +
  scale_fill_gradient(low = palette$paper, high = palette$ink, transform = "log10") +
  labs(
    title    = "From all-rounders to specialists",
    subtitle = "Each row is a player, ordered by what they make on the last day",
    x        = "Good",
    y        = NULL,
    fill     = "Units per hour"
  ) +
  theme_bmh() +
  theme(axis.text.y = element_blank(), panel.grid = element_blank())

  • How to read it: on the left every row is mixed; on the right, look for one dark tile per row and blocks of players sharing a column
Show the code
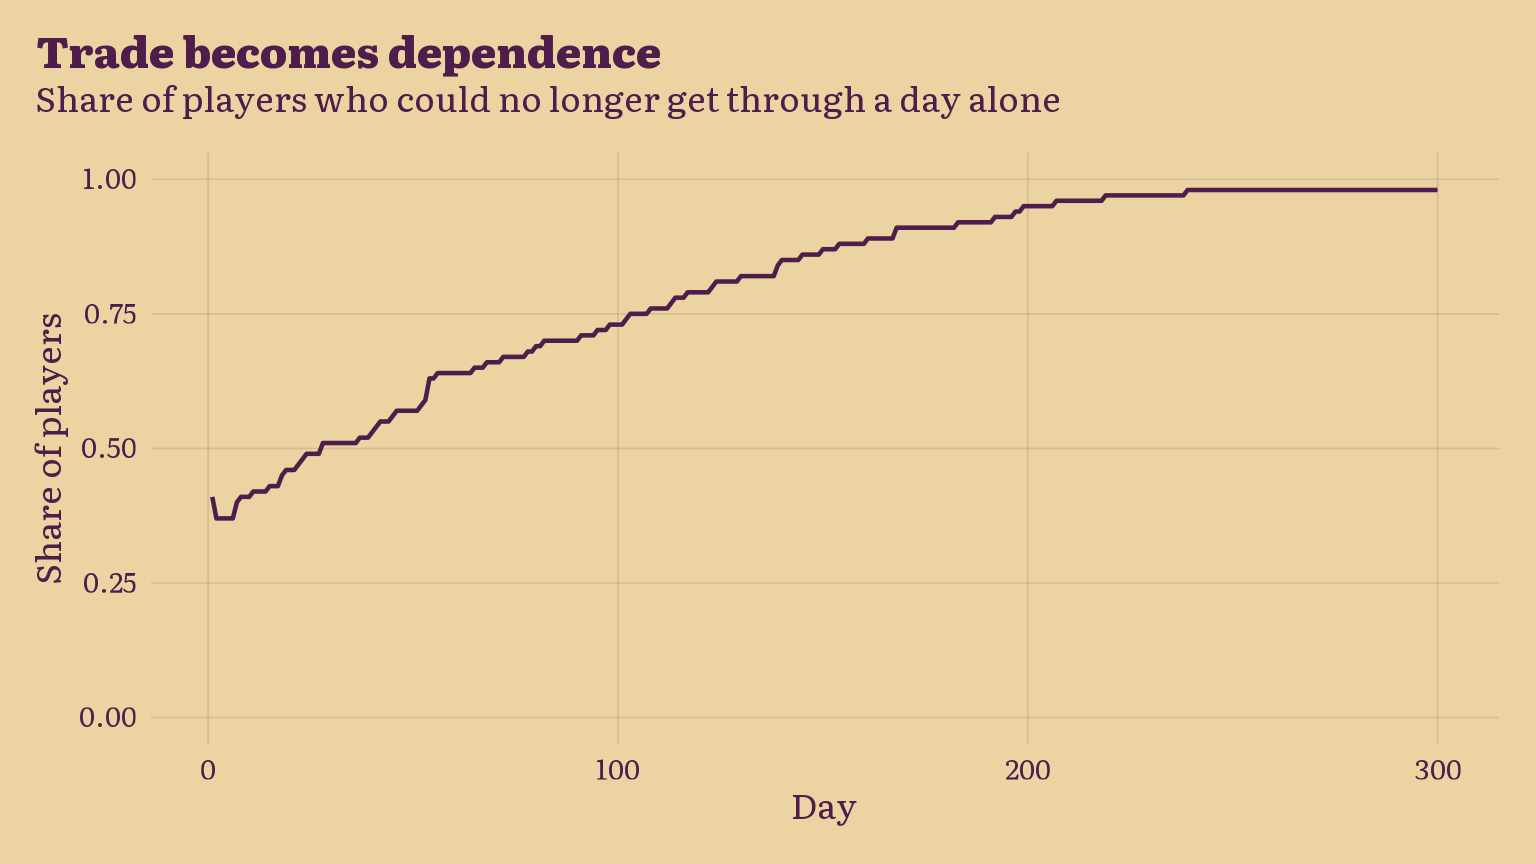
plot_village(calm$players, mean(alone_hours > 12),
             title    = "Trade becomes dependence",
             subtitle = "Share of players who could no longer get through a day alone",
             y        = "Share of players") +
  scale_y_continuous(limits = c(0, 1))

  • How to read it: the line counts players who would need more than 12 hours to make everything themselves; the higher it climbs, the more the village depends on the market

4. Groups

What we simulate

  • A player outside a group can found one; others apply, and a group admits one maker per good
  • Members swap among themselves first, then go to the open market
  • A swap inside a group takes 0.1 hours, against 0.25 on the open market
  • Members give a quarter of an hour a day to the group, as dues
  • Members who do worse than the average outsider may leave; surplus makers are expelled

Example

  • A full group has eight members, one per good, so each makes seven swaps inside
  • Each swap saves 0.15 hours: about one hour a day
  • Dues take back a quarter of an hour, so membership is worth about 0.8 hours a day
  • In a group of three, two swaps save 0.3 hours, barely more than the dues
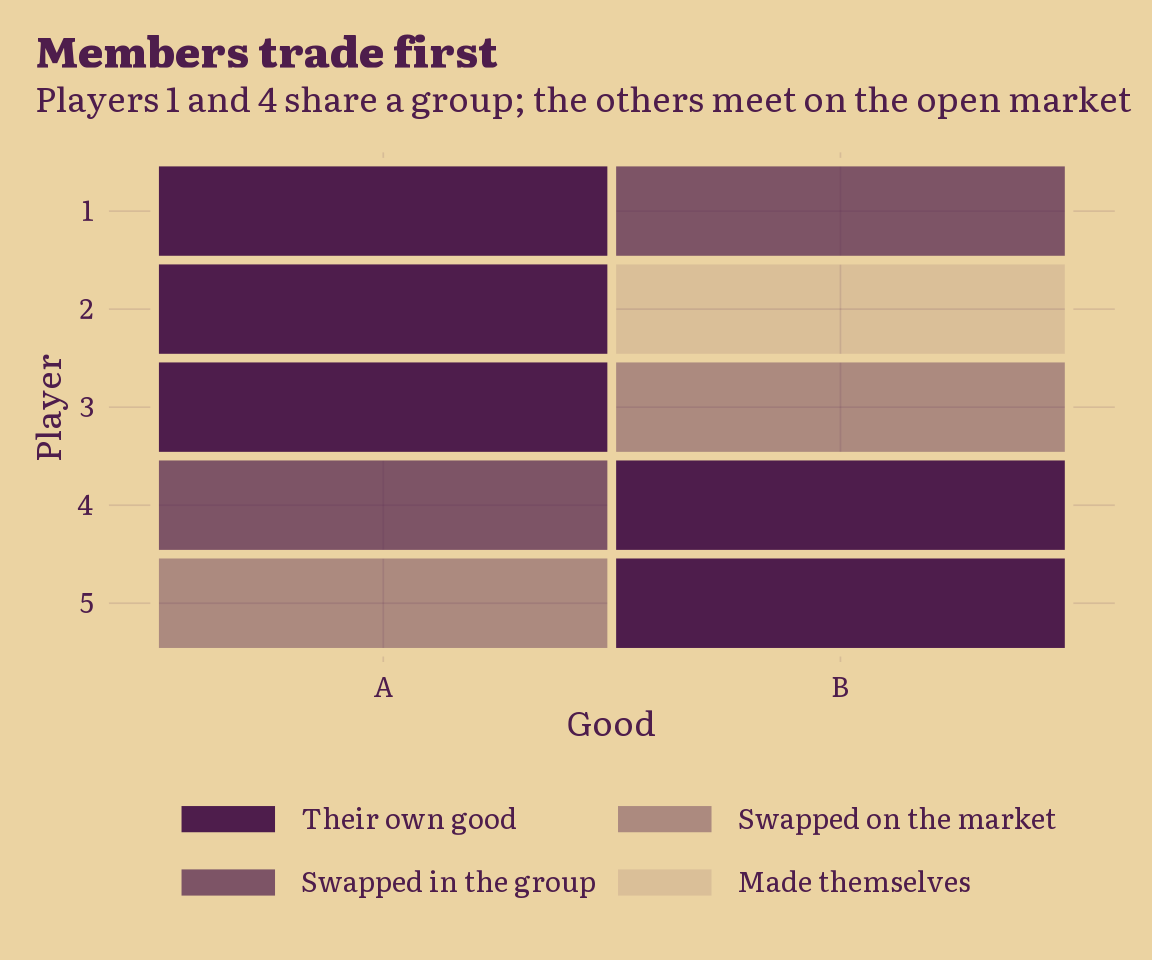
  • Below: players 1 and 4 share a group and swap first; the others meet on the open market
Show the code
choice <- c(1, 1, 1, 2, 2)
group  <- c(1, NA, NA, 1, NA)
wants  <- rbind(c(FALSE, TRUE), c(FALSE, TRUE), c(FALSE, TRUE),
                c(TRUE, FALSE), c(TRUE, FALSE))

swaps <- withr::with_seed(1, {
  inside  <- match_round(choice, wants, segment = group)
  outside <- match_round(choice, wants & !inside, segment = rep(1, 5))
  list(inside = inside, outside = outside)
})

plot_swaps(choice, swaps$inside, swaps$outside,
           title    = "Members trade first",
           subtitle = "Players 1 and 4 share a group; the others meet on the open market")

The run

  • The same village for 500 days, with groups switched on
Show the code
grouped <- run_village(village, n_days = 500, rules = story(groups = list(on = TRUE)))
Show the code
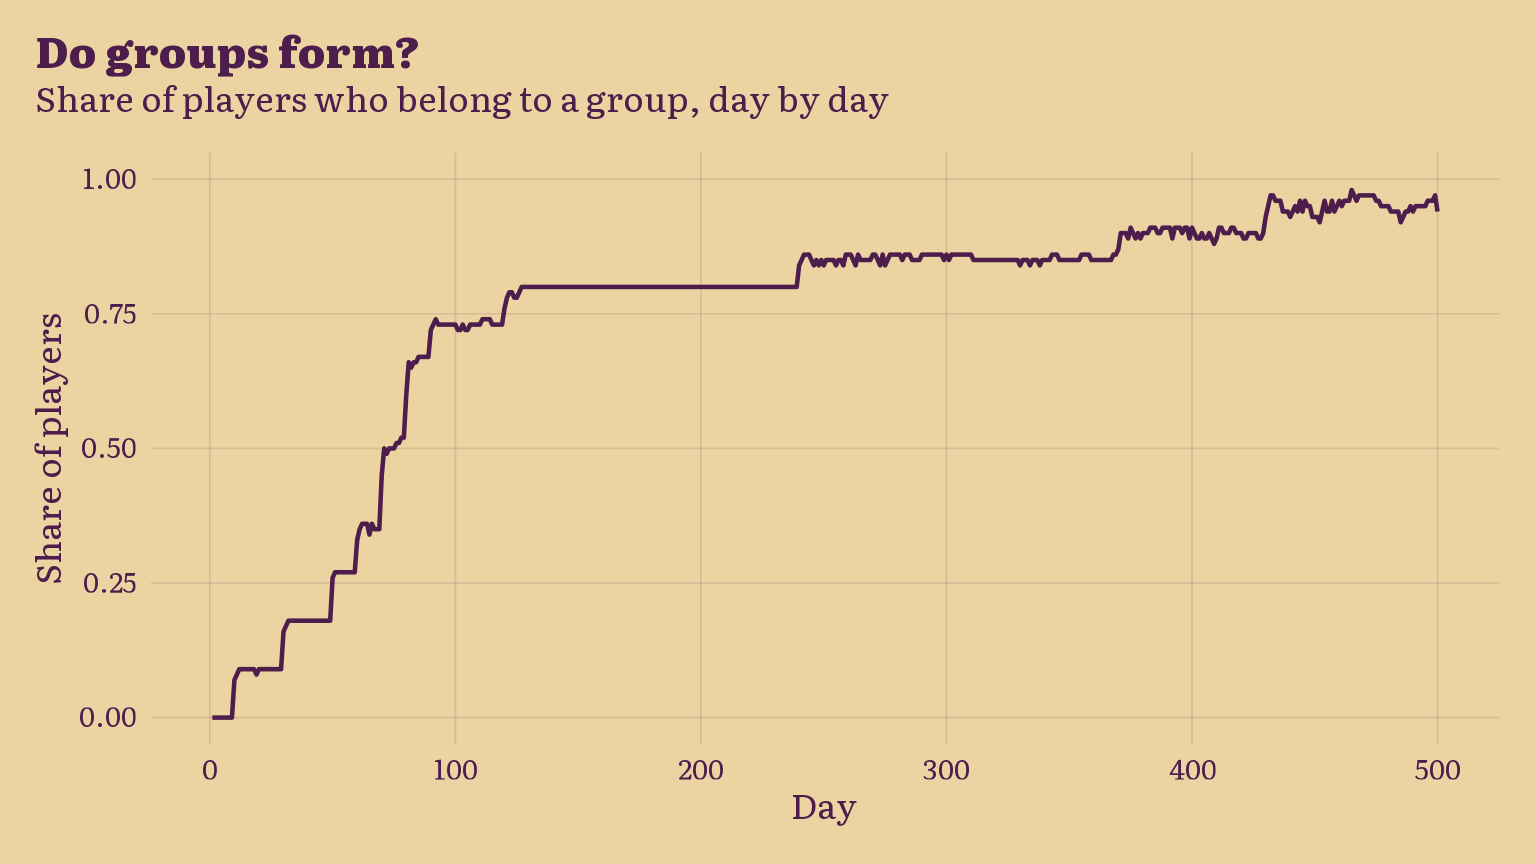
plot_village(grouped$players, mean(!is.na(group)),
             title    = "Do groups form?",
             subtitle = "Share of players who belong to a group, day by day",
             y        = "Share of players") +
  scale_y_continuous(limits = c(0, 1))

  • How to read it: the line is the share of the village inside a group; look at when it takes off and where it stops
Show the code
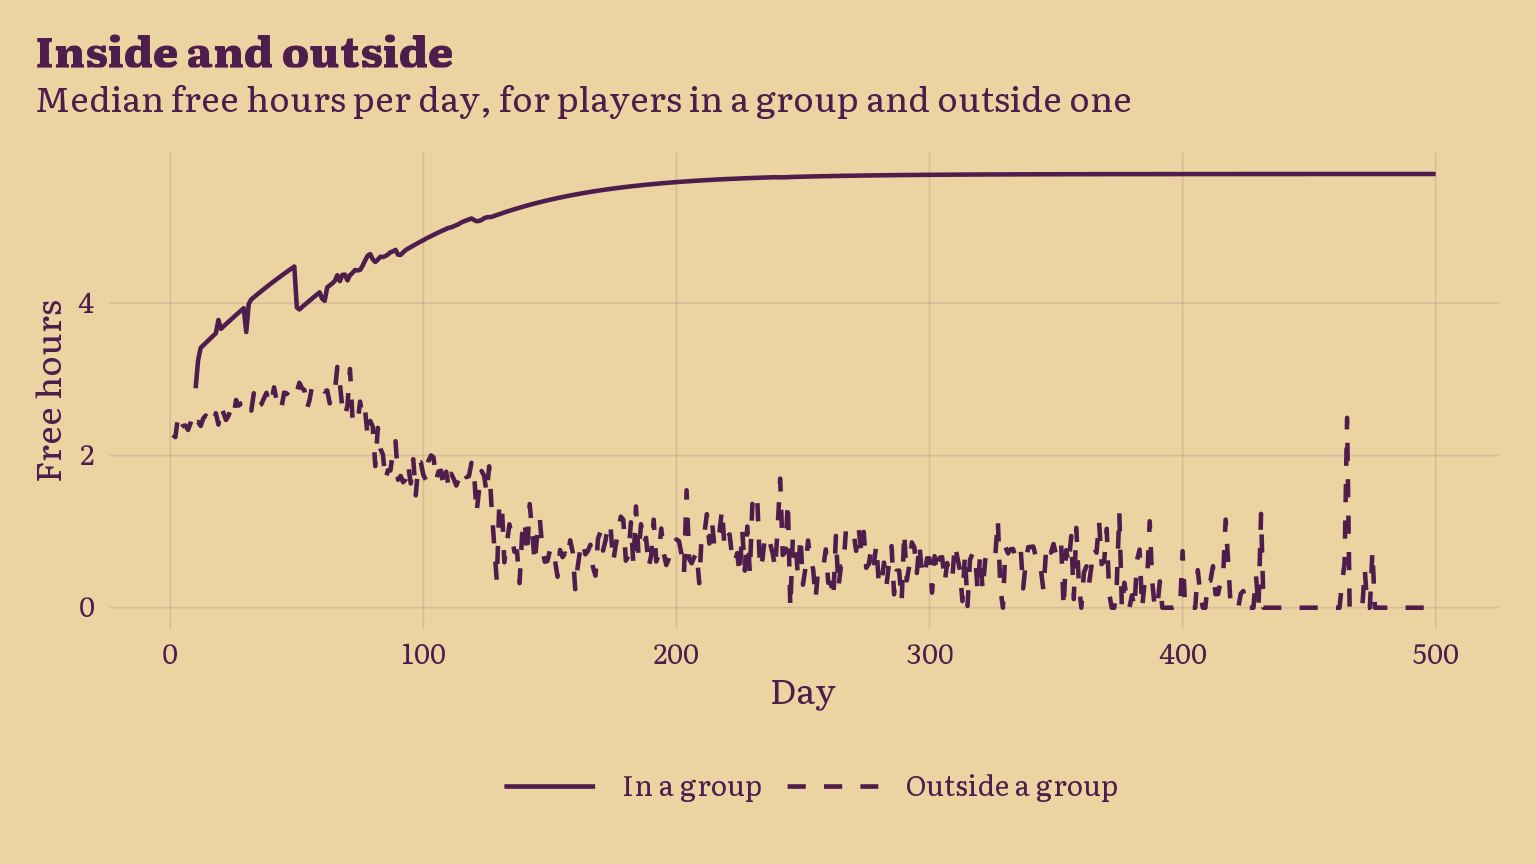
plot_members(grouped$players, median(free_hours),
             title    = "Inside and outside",
             subtitle = "Median free hours per day, for players in a group and outside one",
             y        = "Free hours")

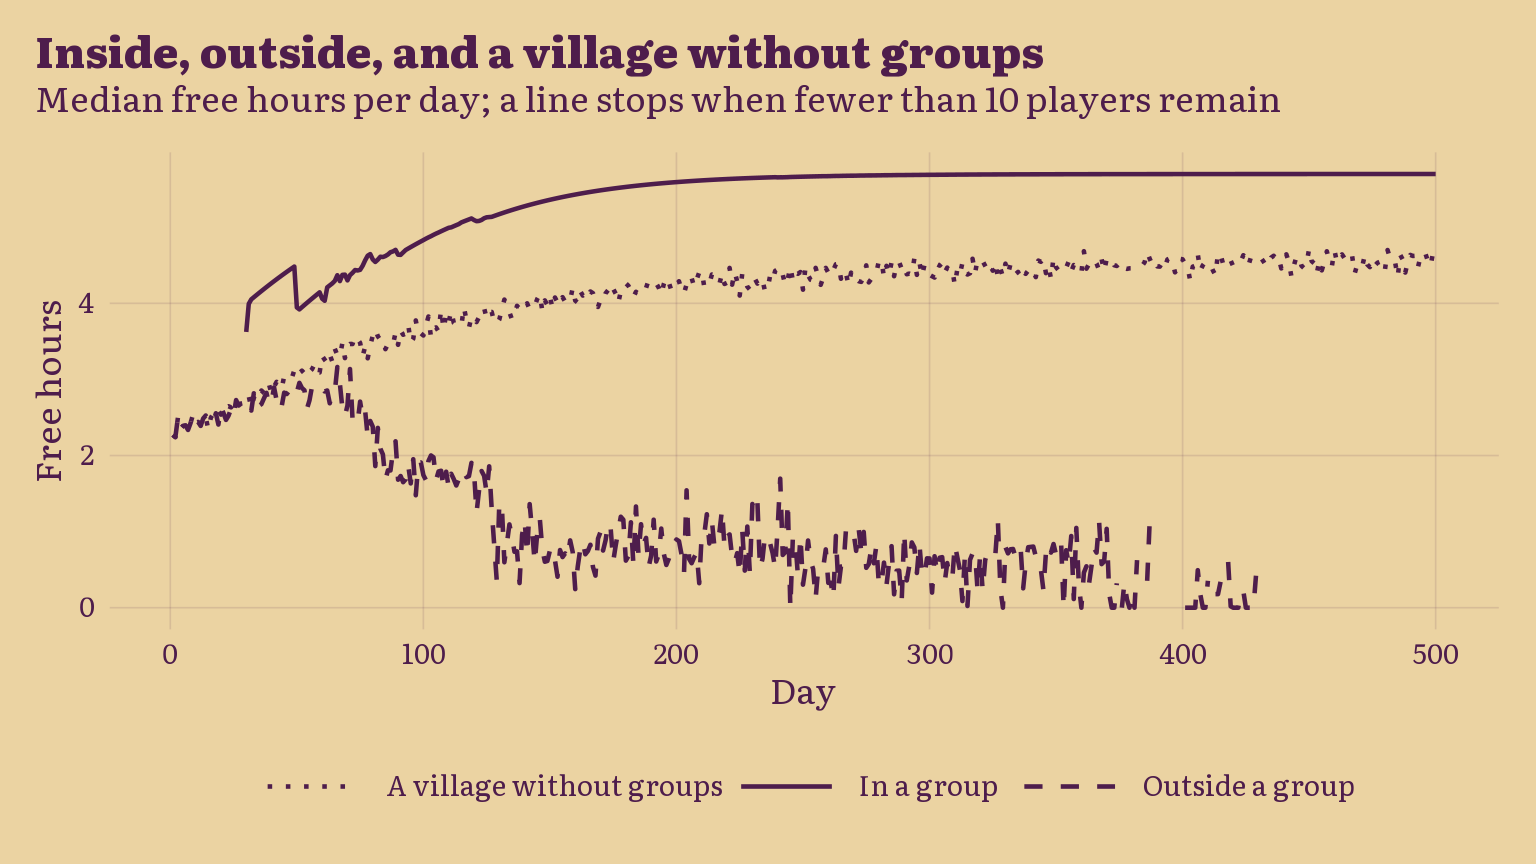
  • How to read it: the gap between the two lines is what membership is worth; watch whether the outside line falls as groups grow, which would mean groups take from outsiders and not only add for members
Show the code
shades <- colorRampPalette(c(palette$paper, palette$ink))(5)

grouped$groups |>
  filter(members > 0) |>
  mutate(group = factor(group, levels = rev(sort(unique(group))))) |>
  ggplot(aes(x = day, y = group, fill = members)) +
  geom_tile(height = 0.8) +
  scale_fill_gradient(low = shades[2], high = palette$ink,
                      breaks = scales::breaks_pretty(4)) +
  labs(
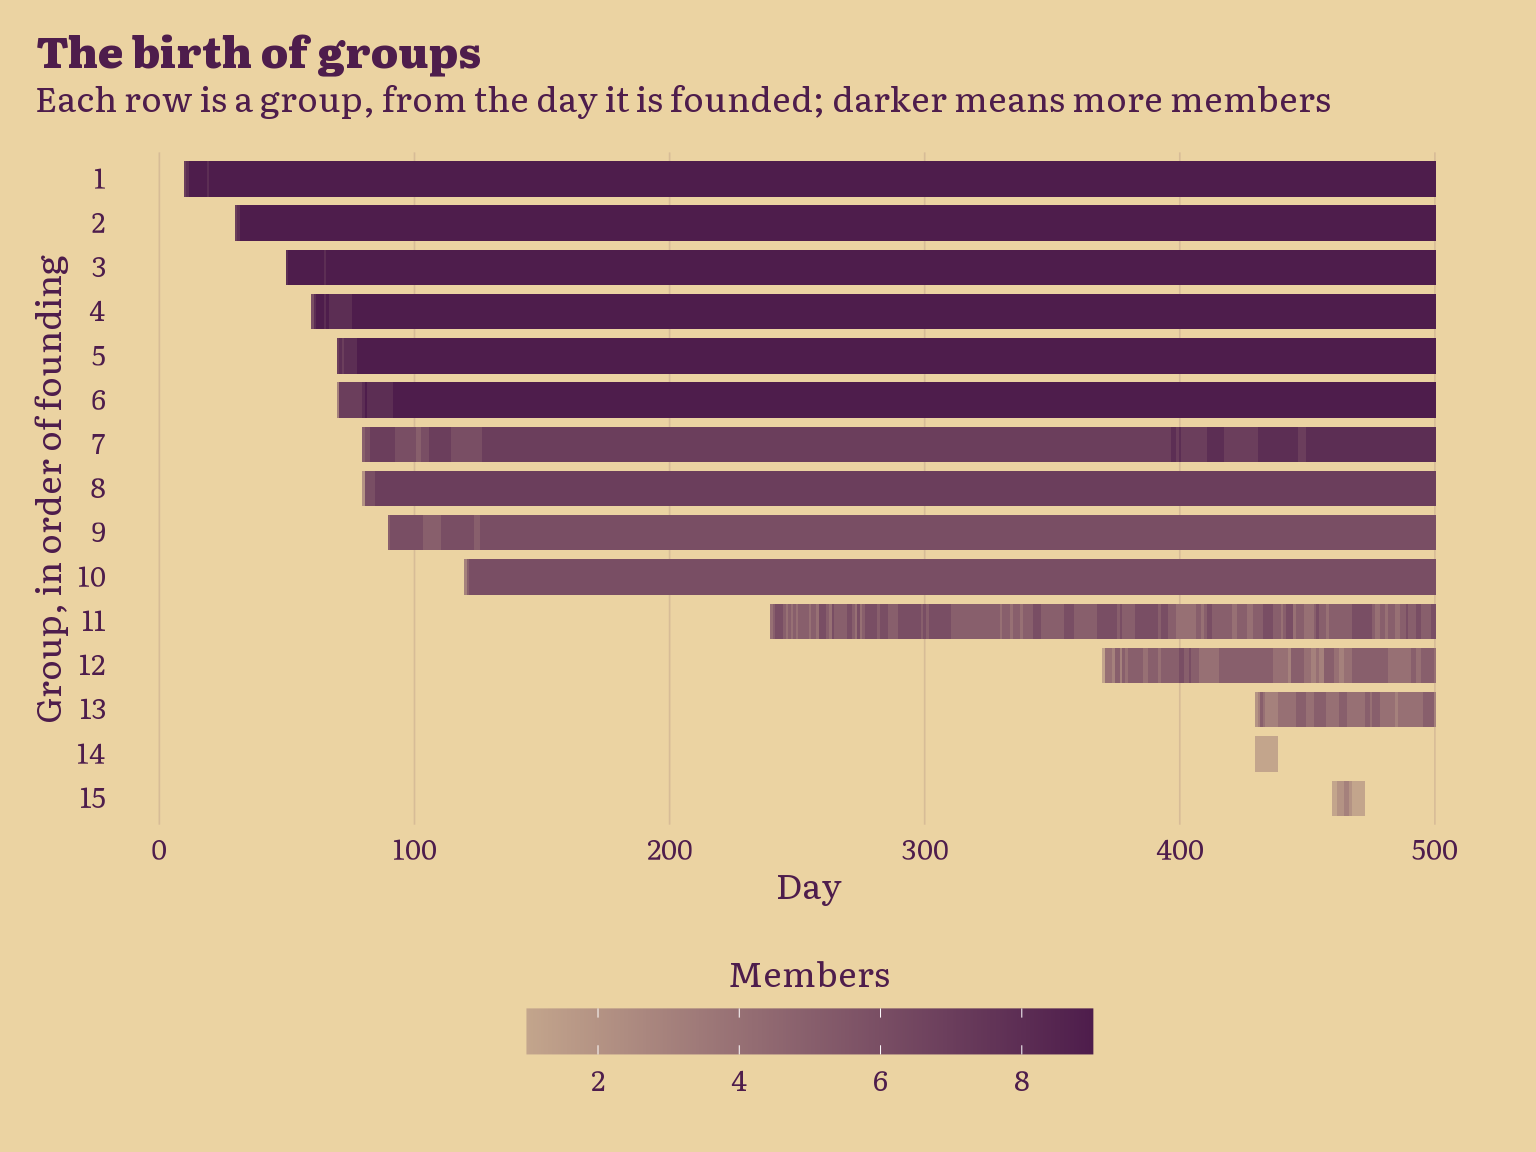
    title    = "The birth of groups",
    subtitle = "Each row is a group, from the day it is founded; darker means more members",
    x        = "Day",
    y        = "Group, in order of founding",
    fill     = "Members"
  ) +
  theme_bmh() +
  theme(panel.grid.major.y = element_blank())

Show the code
full_size <- ncol(village$players$eff)

grouped$groups |>
  summarise(
    founded = first(founded),
    peak    = max(members),
    grew_in = day[which.max(members)] - first(founded),
    at_end  = last(members),
    .by     = group
  ) |>
  summarise(
    `Groups founded`                 = n(),
    `Never got a second member`      = sum(peak == 1),
    `Reached full size`              = sum(peak == full_size),
    `Alive on the last day`          = sum(at_end >= 2),
    `Median days from founding to peak` = median(grew_in[peak > 1])
  ) |>
  pivot_longer(everything(), names_to = "what", values_to = "value") |>
  table_bmh() |>
  cols_label(what = "", value = "")
Groups founded 15
Never got a second member 1
Reached full size 6
Alive on the last day 13
Median days from founding to peak 2

With and without groups?

Show the code
no_groups <- run_village(village, n_days = 500, rules = story())

bind_rows(
  grouped$players |>
    summarise(value = median(free_hours), n = n(), .by = c(day, member)),
  no_groups$players |>
    summarise(value = median(free_hours), n = n(), .by = day) |>
    mutate(member = "A village without groups")
) |>
  mutate(value = if_else(n >= 10, value, NA)) |>
  ggplot(aes(x = day, y = value, linetype = member)) +
  geom_line(na.rm = TRUE) +
  scale_linetype_manual(values = c(`In a group`               = "solid",
                                   `Outside a group`          = "dashed",
                                   `A village without groups` = "dotted")) +
  labs(
    title    = "Inside, outside, and a village without groups",
    subtitle = "Median free hours per day; a line stops when fewer than 10 players remain",
    x        = "Day",
    y        = "Free hours",
    linetype = NULL
  ) +
  theme_bmh()

5. Droughts

What we simulate

  • For three days, one good takes 8 hours per unit, whoever makes it
  • Efficiencies are untouched: the good returns to its usual cost afterwards
  • Two droughts: one in the first days, before any group exists, and one once three groups exist

Example

  • A player usually makes a unit of B in about an hour
  • In a drought on B, that unit takes 8 of their 12 hours
  • A maker of B who also owes units to swap partners runs out of day, and so does anyone who finds no B to swap for

The run

  • Groups on, droughts on
Show the code
droughts <- run_village(village, n_days = 500,
                        rules = story(groups = list(on = TRUE), drought = dry))

droughts$players |>
  filter(!is.na(drought_good)) |>
  summarise(from = min(day), to = max(day), .by = drought_good) |>
  table_bmh() |>
  cols_label(drought_good = "Good hit", from = "From day", to = "To day")
Good hit From day To day
C 326 328
Show the code
plot_members(droughts$players, median(free_hours),
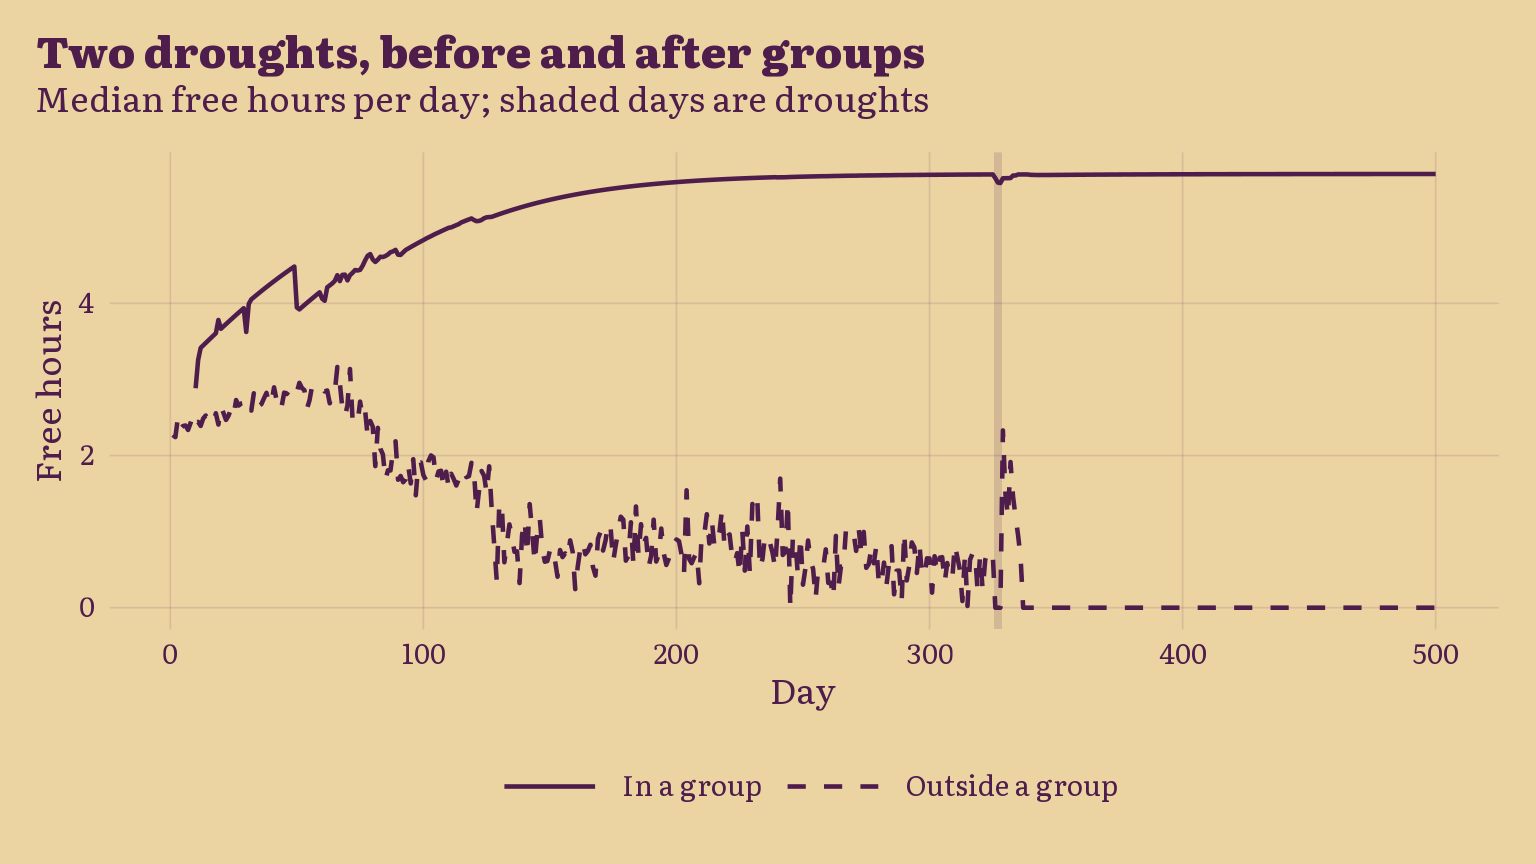
             title    = "Two droughts, before and after groups",
             subtitle = "Median free hours per day; shaded days are droughts",
             y        = "Free hours")

  • How to read it: compare the dip at the two shaded bands; at the second, compare the solid and dashed lines to see who is hit harder
Show the code
plot_members(droughts$players, mean(status == "short"),
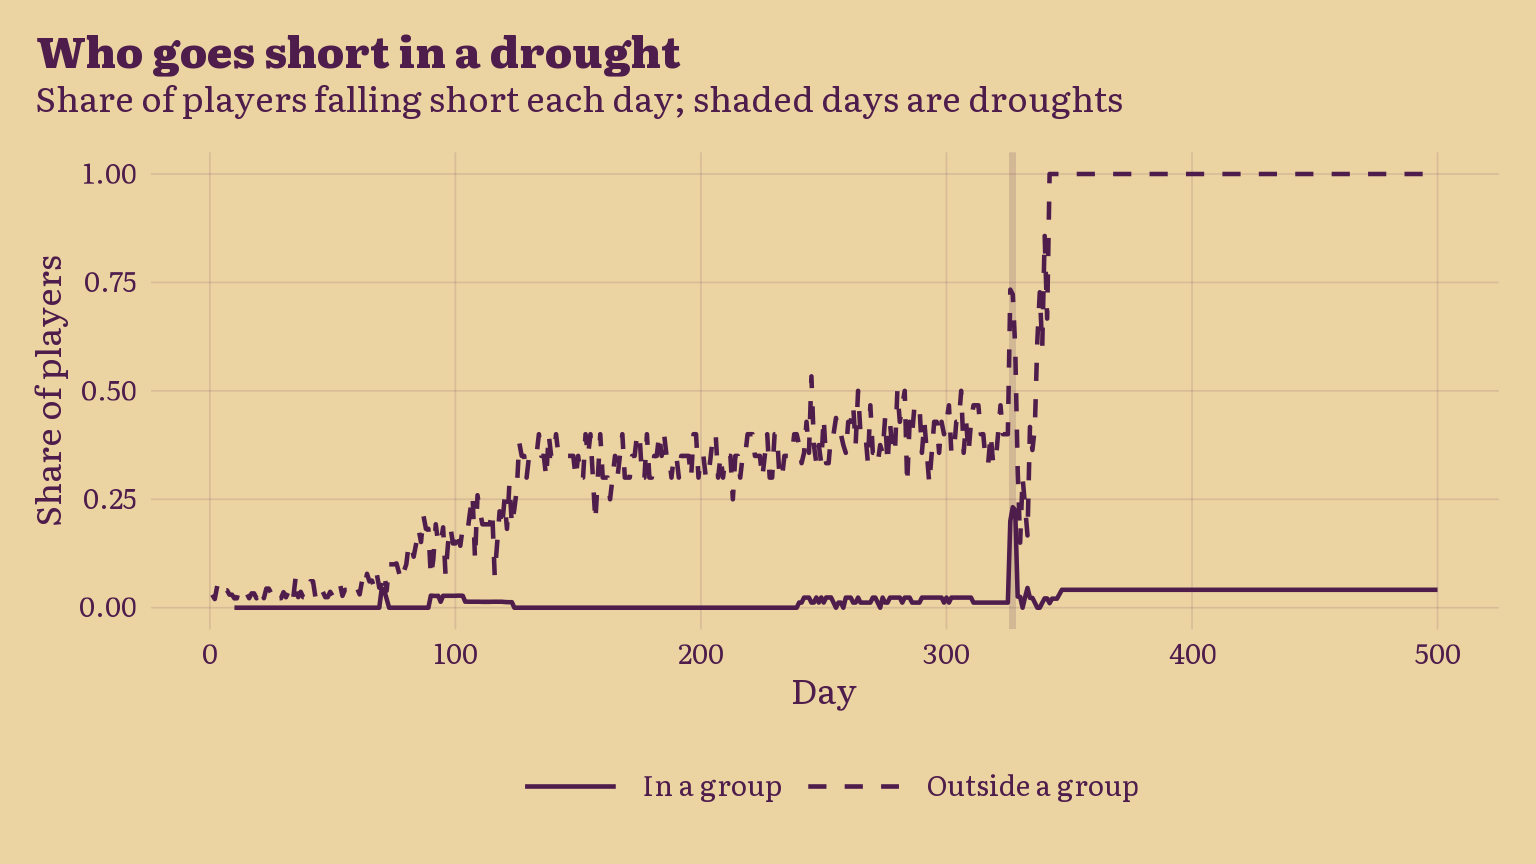
             title    = "Who goes short in a drought",
             subtitle = "Share of players falling short each day; shaded days are droughts",
             y        = "Share of players")

  • How to read it: a player is short when 12 hours are not enough for the day; look at which line spikes in the second drought

6. Taxes

What we simulate

  • Every five days, each group votes on taxing outsiders who swap with its members
  • An outsider pays half an hour per swap with a member of a taxing group; the member receives it
  • Sellers who tax are served last on the open market, so a tax can cost them customers
  • Each member votes by their own sum: tax income against swaps lost; now and then a member votes the other way (tax$disturbance)
  • How the votes add up is a rule too: majority, weighted by swaps, or any function

Example

  • A member makes four swaps a day with outsiders: a tax would bring two hours a day if all four customers stay
  • If untaxed sellers take those customers, the member makes those goods alone and loses more than two hours; they vote no
  • Below: the same three votes under three voting rules
Show the code
yes    <- c(TRUE, TRUE, FALSE)
weight <- c(1, 1, 10)

tibble(
  rule   = c("Majority", "Weighted by swaps", "Unanimity"),
  passes = c(tally_votes(yes, weight, "majority"),
             tally_votes(yes, weight, "weighted"),
             tally_votes(yes, weight, \(yes, weight) all(yes)))
) |>
  table_bmh() |>
  cols_label(rule = "Voting rule", passes = "Tax passes") |>
  tab_source_note("Three members: two in favour with 1 swap each, one against with 10 swaps.")
Voting rule Tax passes
Majority TRUE
Weighted by swaps FALSE
Unanimity FALSE
Three members: two in favour with 1 swap each, one against with 10 swaps.

The run

  • Groups, droughts and the tax vote, with majority voting
Show the code
taxes <- run_village(village, n_days = 500,
                     rules = story(groups = list(on = TRUE), 
                                   drought = list(on = FALSE),
                                   tax = list(on = TRUE)))
Show the code
taxes$players |>
  filter(!is.na(group)) |>
  plot_village(mean(taxed),
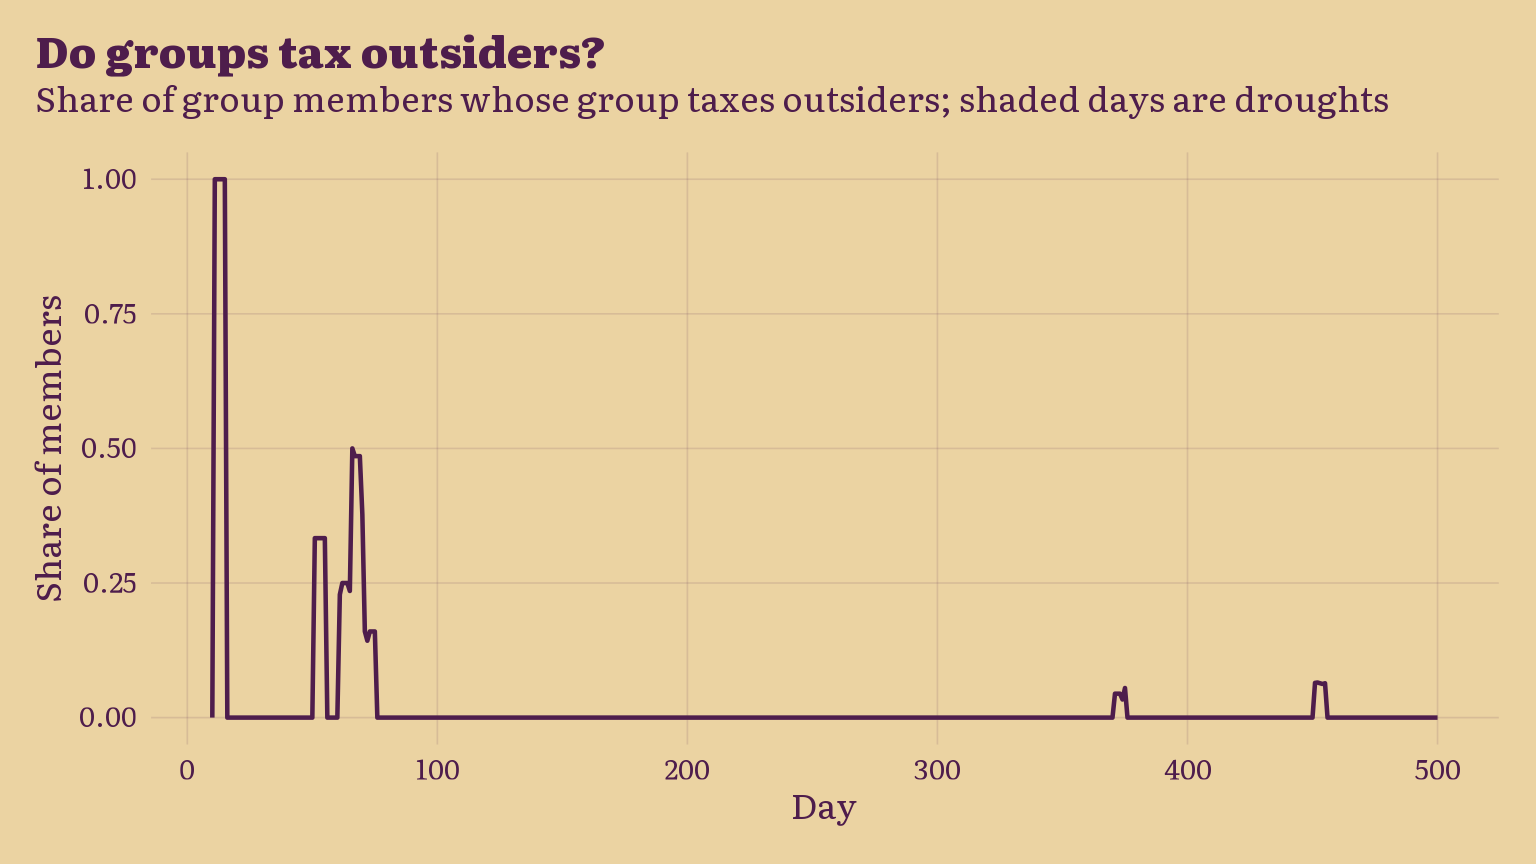
               title    = "Do groups tax outsiders?",
               subtitle = "Share of group members whose group taxes outsiders; shaded days are droughts",
               y        = "Share of members") +
  scale_y_continuous(limits = c(0, 1))

  • How to read it: the line is the share of members living under a tax; a flat line near zero means full groups trade too little outside for a tax to pay
Show the code
plot_members(taxes$players, median(free_hours),
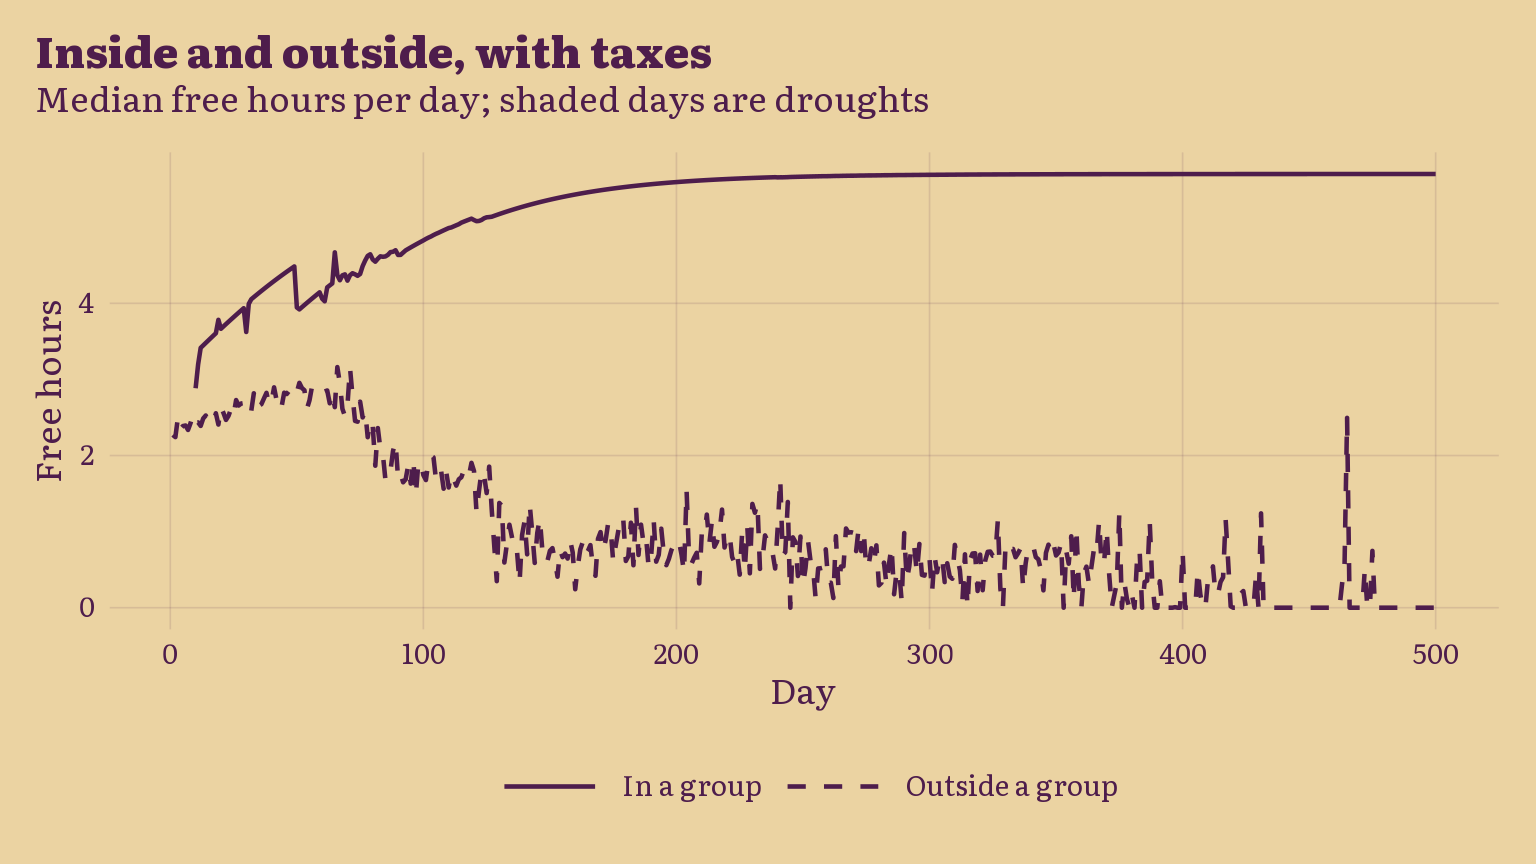
             title    = "Inside and outside, with taxes",
             subtitle = "Median free hours per day; shaded days are droughts",
             y        = "Free hours")

  • How to read it: compare the gap between the lines with the same plot in section 5; a wider gap means taxes move hours from outsiders to members

7. A new product

What we simulate

  • After the second drought, a player may invent a cheaper way to meet one need
  • The new way is three times as efficient as the village’s average for that good
  • The inventor’s group learns it at once
  • Everyone else learns it by buying it: after ten purchases, a buyer can make it too, at half the makers’ level

Example

  • The village makes good C at about 0.8 units per hour on average: an hour and a quarter per unit
  • The inventor now makes 2.4 units per hour: 25 minutes per unit
  • A player who buys C from the new makers for ten days starts making it at about 1.2 units per hour

The run

  • Everything on: groups, droughts, taxes, and the invention
Show the code
invented <- run_village(village, n_days = 500,
                        rules = story(groups = list(on = TRUE), 
                                      drought = list(on = FALSE),
                                      tax = list(on = FALSE), invention = list(on = TRUE)))

invention <- invented$players |>
  filter(!is.na(new_need)) |>
  summarise(day = min(day), need = first(new_need), inventor = first(inventor))

inventor_group <- invented$players |>
  filter(day == invention$day, player == invention$inventor) |>
  pull(group)

invention |>
  mutate(group = inventor_group) |>
  table_bmh() |>
  cols_label(day = "Invented on day", need = "Replaces good", inventor = "Inventor",
             group = "Inventor's group") |>
  sub_missing(group, missing_text = "none")
Invented on day Replaces good Inventor Inventor's group
134 B 66 2
Show the code
invented$players |>
  filter(!is.na(new_need)) |>
  summarise(knows = mean(knows_new), .by = day) |>
  ggplot(aes(x = day, y = knows)) +
  geom_area(fill = alpha(palette$ink, 0.3)) +
  geom_line(linewidth = 0.5) +
  scale_y_continuous(limits = c(0, 1)) +
  labs(
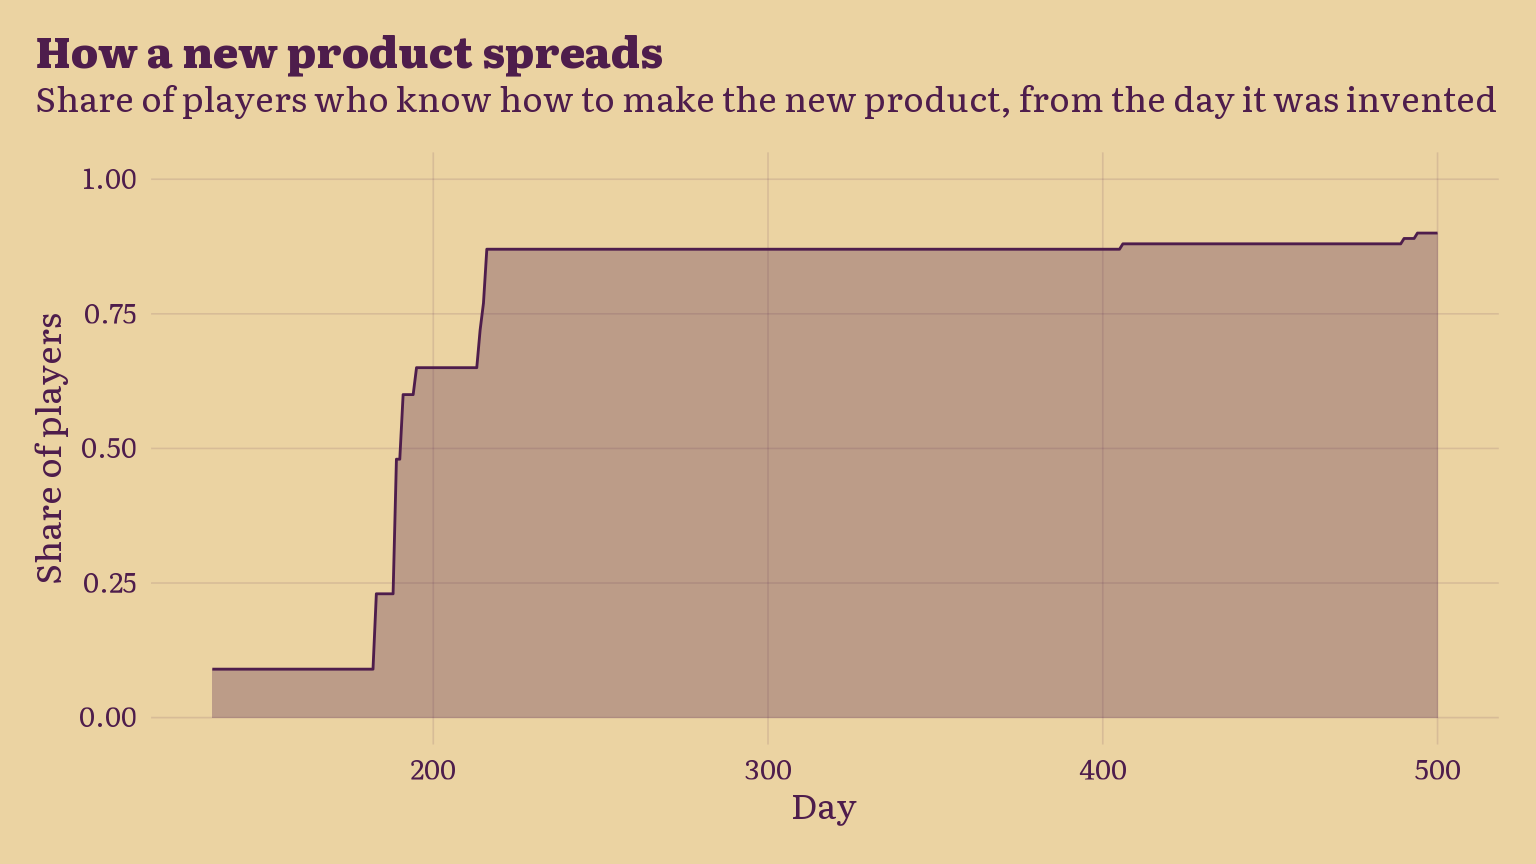
    title    = "How a new product spreads",
    subtitle = "Share of players who know how to make the new product, from the day it was invented",
    x        = "Day",
    y        = "Share of players"
  ) +
  theme_bmh()

  • How to read it: the first step up is the inventor’s group; everything after is players learning by buying, so the slope is the speed of diffusion
Show the code
roles <- invented$players |>
  filter(day == invention$day - 1) |>
  mutate(role = case_when(
    player == invention$inventor |
      (!is.na(inventor_group) & group %in% inventor_group) ~ "The inventor and their group",
    choice == invention$need                               ~ "Makers of the old good",
    .default                                               = "Everyone else"
  )) |>
  select(player, role)

invented$players |>
  filter(day >= invention$day - 30) |>
  left_join(roles, by = "player") |>
  summarise(free_hours = median(free_hours), .by = c(day, role)) |>
  ggplot(aes(x = day, y = free_hours, linetype = role)) +
  geom_vline(xintercept = invention$day, colour = alpha(palette$ink, 0.4)) +
  geom_line() +
  scale_linetype_manual(values = c(`The inventor and their group` = "solid",
                                   `Makers of the old good`       = "dashed",
                                   `Everyone else`                = "dotted")) +
  labs(
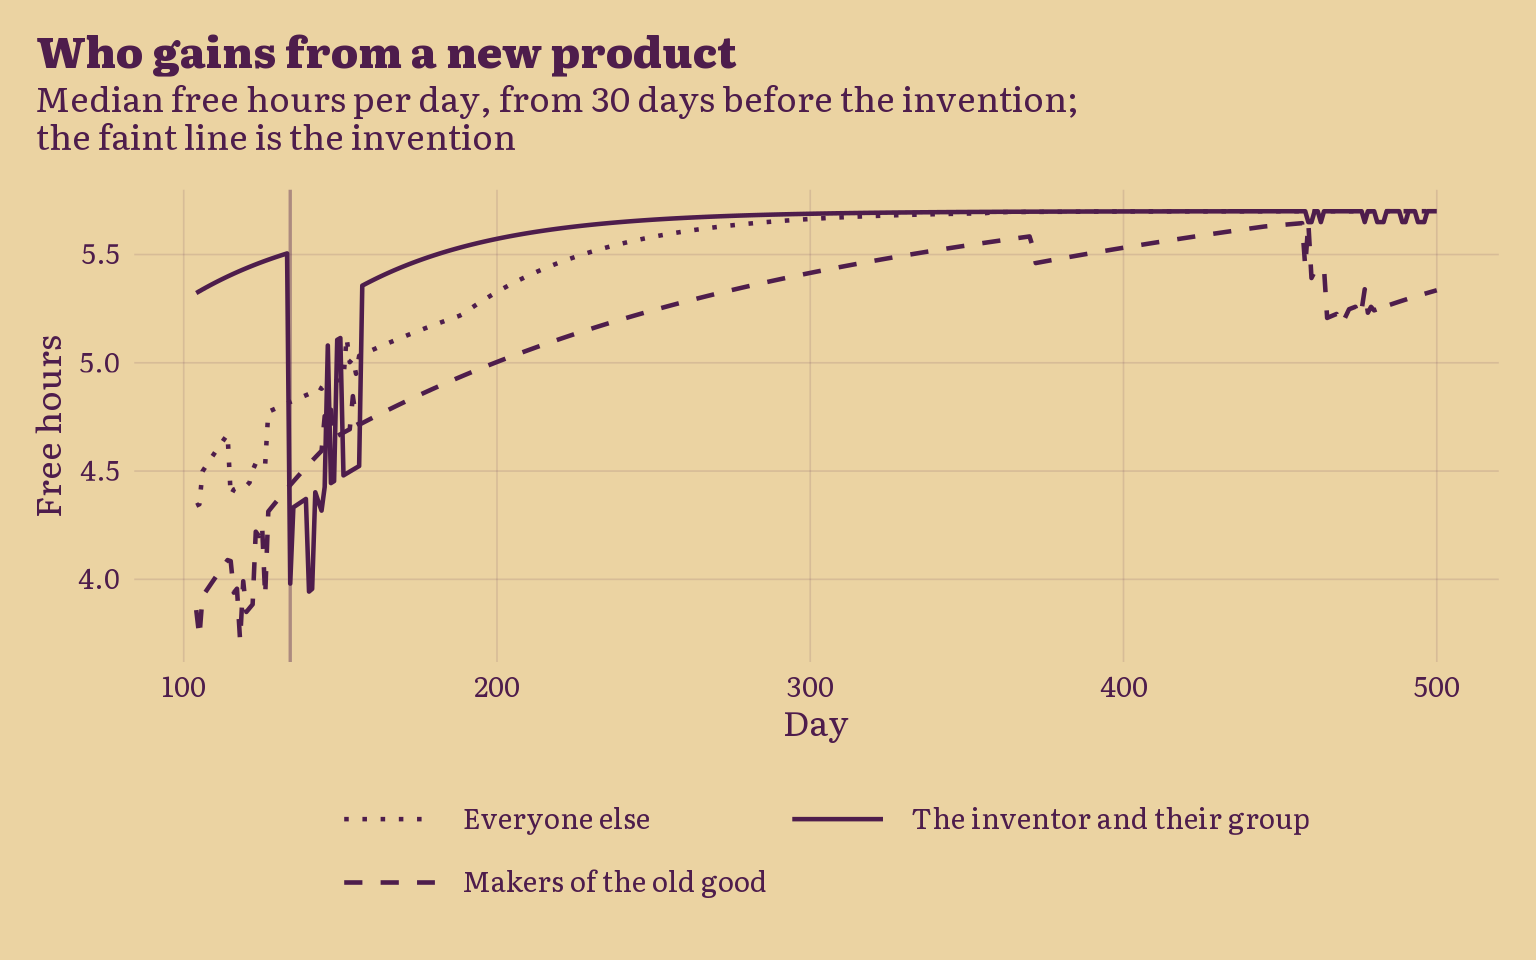
    title    = "Who gains from a new product",
    subtitle = "Median free hours per day, from 30 days before the invention; \nthe faint line is the invention",
    x        = "Day",
    y        = "Free hours",
    linetype = NULL
  ) +
  guides(linetype = guide_legend(ncol = 2)) +
  theme_bmh()

  • How to read it: compare each line before and after the faint vertical line; the dashed line is the makers the invention replaces

What we learned

  • One line per section, once the plots are in
  • Open question: do groups create value for the village, or move it to their members?
  • Limits to state: one village and one seed; players judge by the whole village and ignore their group’s priority; no prices
  • Next: many seeds, entry rules, and the trade network

Appendix: how souk is built

  • Four pieces: rules, a village, a schedule of steps, a run
flowchart LR
  classDef default fill:#ebd3a2,stroke:#4e1d4c,color:#4e1d4c
  R["set_rules()<br/>every parameter"] --> RUN["run_village()"]
  V["new_village()<br/>players and their skills"] --> RUN
  S["default_schedule()<br/>the steps of a day"] --> RUN
  RUN --> D["play_day()<br/>repeated n_days times"]
  D --> REC["recorders"]
  REC --> P["$players<br/>one row per player per day"]
  REC --> G["$groups<br/>one row per group per day"]
  RUN --> E["$start, $end<br/>the village before and after"]
  • A day is a schedule of steps; each takes the village and returns it
flowchart LR
  classDef default fill:#ebd3a2,stroke:#4e1d4c,color:#4e1d4c
  EV["step_events<br/>droughts, inventions,<br/>hours per unit"] --> ME["step_membership<br/>leave, expel,<br/>found, join"]
  ME --> SP["step_specialise<br/>choose a good"]
  SP --> MA["step_market<br/>swap, pay taxes,<br/>count hours"]
  MA --> LE["step_learn<br/>new product"]
  LE --> IN["step_invest<br/>free hours into skills"]
  IN --> GO["step_govern<br/>vote on taxes"]
  • The rules used in this post; everything has a default, and a typo is an error
Rule Value
day_length 12
need 1
min_work 2
check TRUE
Rule Value
lambda 0.05
forget 0.002
e_max 2
e_min 0.5
floor_share 0.5
Rule Value
revise 0.2
Rule Value
swap_cost 0.25
swap_cost_group 0.2
Rule Value
on FALSE
found 0.01
found_every 10
found_from 10
max_same 1
beta 0
dues 0.2
Rule Value
on FALSE
rate 0.5
vote_every 5
disturbance 0.1
voting majority
Rule Value
on FALSE
hours 8
length 3
p 0
groups_needed 3
Rule Value
on FALSE
p 1e-04
advantage 3
after_droughts 2
share_in_group TRUE
learn_days 10
learn_share 0.5