I started this blog a very long time ago, when I was young, brave, unmedicated, and untolerant to boredom. It was a side quest that I started because I refused to be bored, I refused to not be excited. I reinvented this website few times since then, for the same reasons. And now, one more time, I’m trying to reinvent my brand as a researcher through this digital island.
However, this time, the stakes are higher and I can’t get away with some simple data visualisations, or some stupid dashboard. Nowadays, as the imminent PhD defence date gets closer, I have to upgrade my game and rebrand. Althjough in this case, as a side quest, since I have so many other important tasks that actually require my attention. But, I guess it’s a tradition now, to reinvent myself, by reinventing this website everytime a new chapter of my life begins.
So, to that end, I was thinking that the entirety of the projects list I had in this website were not up to the standards I should hold myself to. So I decided that my rebranding side quest should be about showcasing these standards. As I started my research process to achieve this, I realised that the process itself, the fourth wall, is also worth documenting. So here we are.
In this post, I have a single objective. Walk through the process, of finding exciting datasets and resources. Where we can ask interesting questions, and answer them in a clear, organised and methodlogical way. But as I side quested into redesigning the whole website, I thought maybe it would be better to walk through the design process, and some choices I made in here.
Show the code
pacman::p_load( tidyverse, showtext)# Every font that appears in this story, downloaded once from Google Fonts.# R draws with fixed weights, so Literata is registered once per weight we use.font_add_google("Literata", "literata", regular.wt =400, bold.wt =700)font_add_google("Literata", "literata-500", regular.wt =500)font_add_google("Literata", "literata-600", regular.wt =600)font_add_google("Literata", "literata-800", regular.wt =800)font_add_google("Abril Fatface", "abril")font_add_google("Patua One", "patua")font_add_google("DM Mono", "dm-mono")showtext_auto()knitr::opts_chunk$set(fig.showtext =TRUE)# The two palettes: the first attempt and the one that survived.first_palette <-c("Isabella"="#c5a56e","Red Violet"="#59256a","Cinnamon Rufous"="#c27544","Antwerp Blue"="#007190")final_palette <-c("Ivory Buff"="#ebd3a2","Dusky Madder Violet"="#4e1d4c")paper <- final_palette[["Ivory Buff"]]ink <- final_palette[["Dusky Madder Violet"]]# One plot theme for the whole post: the site's paper, ink, and font.theme_bmh <-function(base_size =13) {theme_void(base_size = base_size, base_family ="literata") +theme(plot.background =element_rect(fill = paper, colour =NA),text =element_text(colour = ink),plot.title =element_text(family ="literata-800", size =rel(1.4),margin =margin(b =4), hjust =0.5),plot.subtitle =element_text(face ="italic", margin =margin(b =14), hjust =0.5),plot.margin =margin(20, 20, 20, 20) )}
The starting point
I’ve got into the design rabbit hole a while back to improve my slides and my visual communication in general. Academics are known to have horrible taste in slides and visualisation, I’m not the exception. Eventually, I stumled into this repo by Zara Zhang. And I realised that colors, fonts, and the structure of the medium are as important as its content.
From there I set two simple criteria for the new version of this website, the first is that it must match my own taste, and the second that it must make the experience navigating and reading my content comfortable.
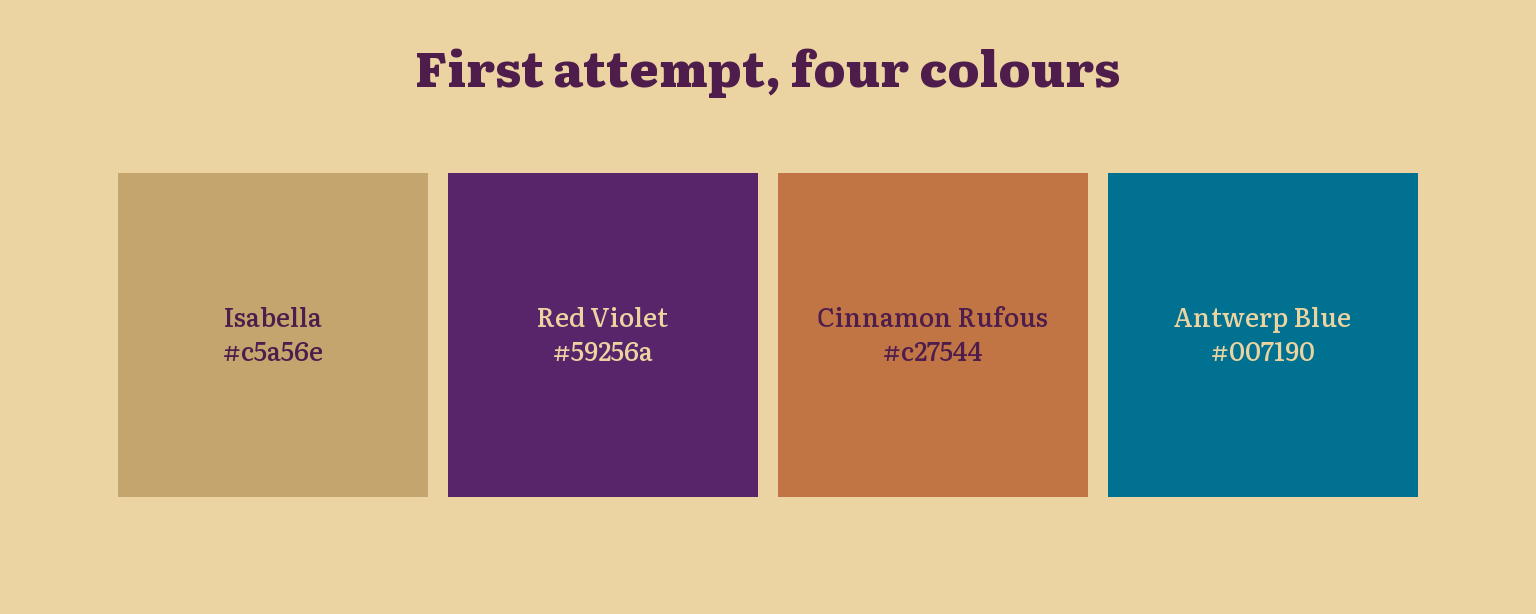
My first palette relied on some combination inspired by Sanzo Wada’s color dictionary, you may find some samples in here. I started with four colors: Isabella gold, Red Violet, Cinnamon Rufous, and Antwerp Blue.
Show the code
swatches <-data.frame(palette =rep(c("First attempt", "Final"), times =c(4, 2)),name =c(names(first_palette), names(final_palette)),hex =c(first_palette, final_palette))swatches$palette <-factor(swatches$palette, levels =c("Final", "First attempt"))swatches$x <-ave(seq_along(swatches$name), swatches$palette, FUN = seq_along)# Each label is written in whichever site colour reads better on that swatch.swatches$label_colour <-ifelse(contrast(swatches$hex, ink) >contrast(swatches$hex, paper), ink, paper)swatches |>filter(palette !="Final") |>ggplot(aes(x, palette)) +geom_tile(aes(fill = hex), width =0.94, height =0.86) +geom_text(aes(label =paste0(name, "\n", hex), colour = label_colour),family ="literata-500", size =3.4, lineheight =1.1) +scale_fill_identity() +scale_colour_identity() +labs(title ="First attempt, four colours") +theme_bmh()
Figure 1
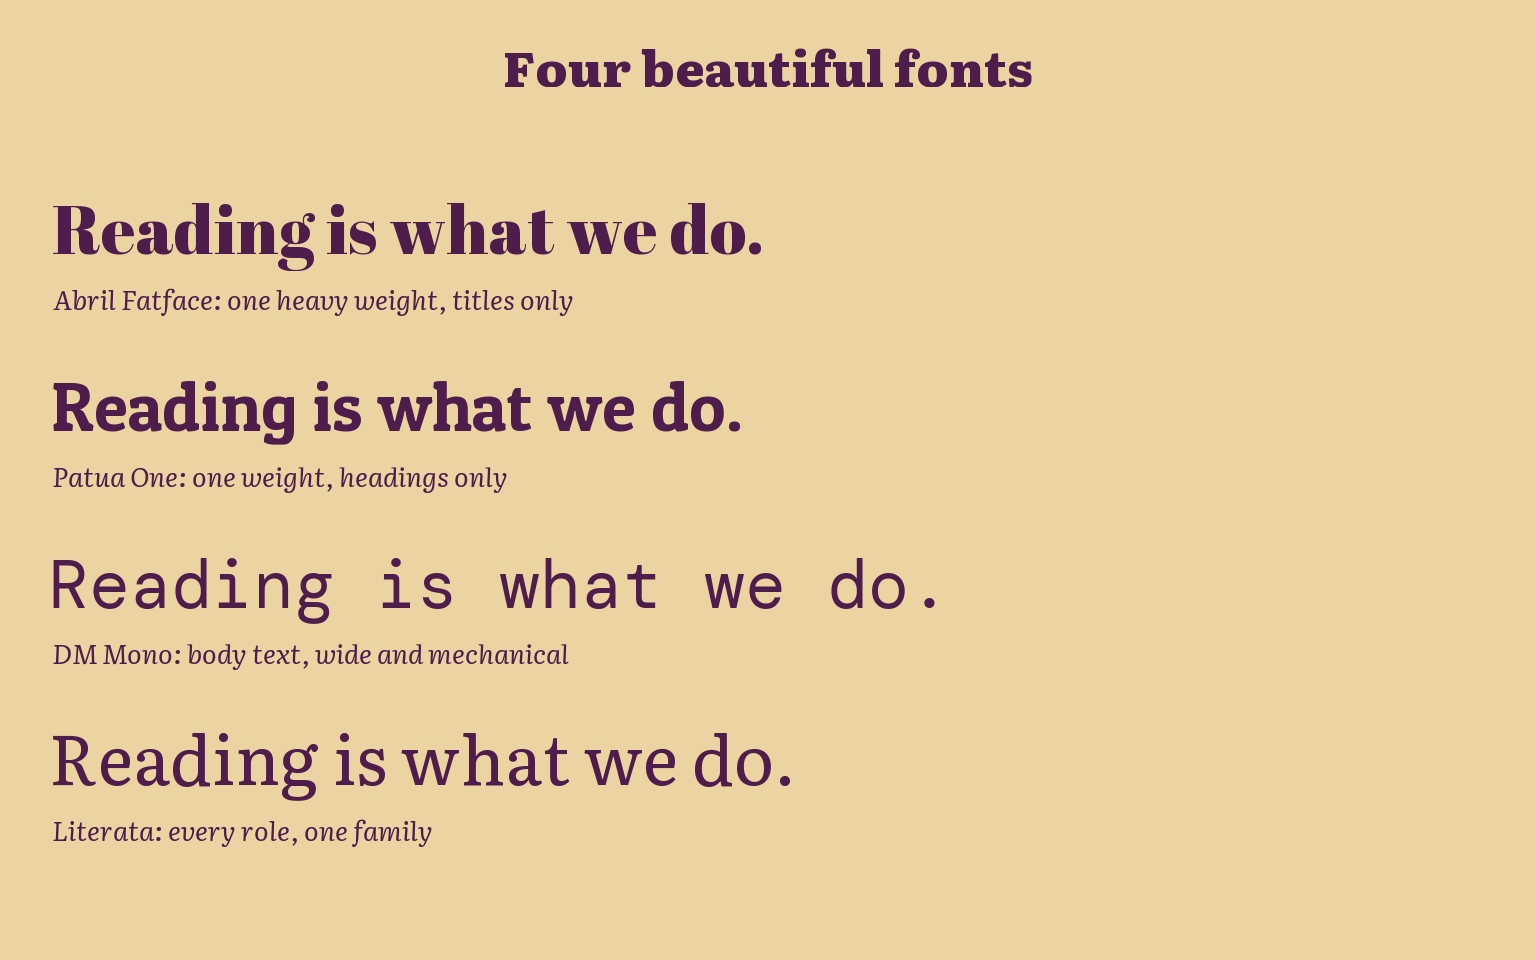
Then I started looking at different fonts, I thought of using my faculty’s own. But Google fonts provide more diverse choices and I was still experimenting.
I ended up looking at these specific fonts:
Show the code
journey <-data.frame(family =c("abril", "patua", "dm-mono", "literata"),caption =c("Abril Fatface: one heavy weight, titles only","Patua One: one weight, headings only","DM Mono: body text, wide and mechanical","Literata: every role, one family"),y =4:1)ggplot(journey) +geom_text(aes(x =0, y = y +0.12, label ="Reading is what we do.", family = family),hjust =0, size =9, colour = ink) +geom_text(aes(x =0, y = y -0.28, label = caption),hjust =0, size =3.6, family ="literata", fontface ="italic", colour = ink) +scale_x_continuous(limits =c(0, 1), expand =c(0, 0)) +scale_y_continuous(limits =c(0.5, 4.6)) +labs(title ="Four beautiful fonts") +theme_bmh()
Figure 2
Less is more?
With all these options, the possible combinations for my set up are just too much for my distracted brain to handle. So I decided to have the simplest possible design set. Two colors, and a single font.
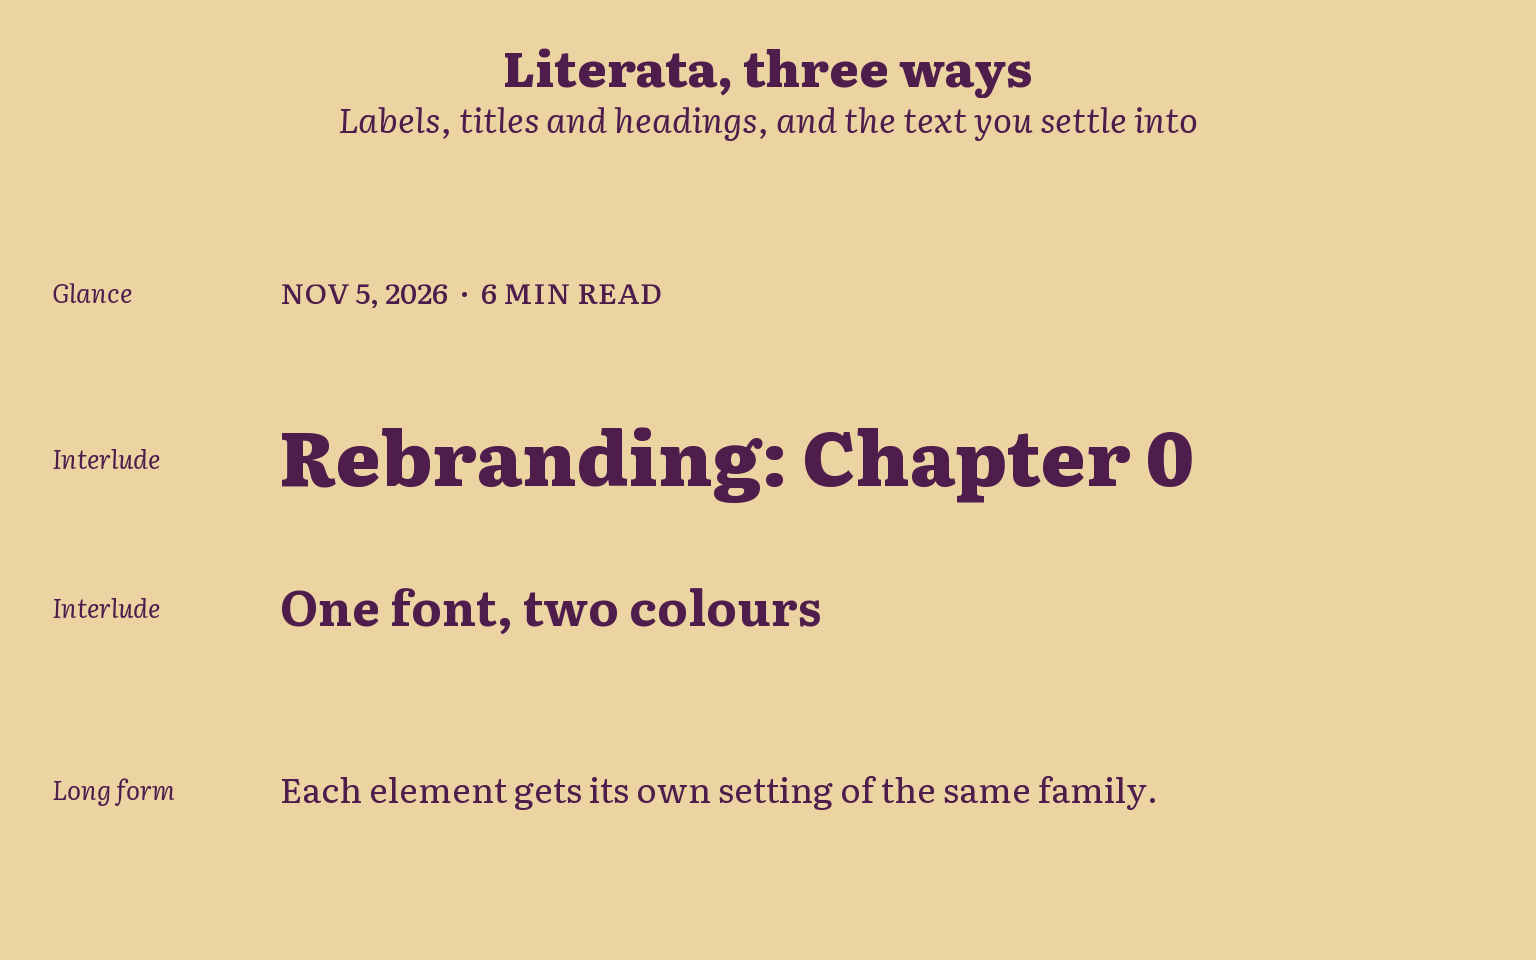
So I went back to reading: Google’s article on how type influences readability, The Economist’s type system, and Nielsen Norman Group’s research on how people read online. Together they gave me one principle: one serif, three reading modes. People glance at navigation and dates, read headings and summaries in short interludes, and settle into long-form reading in the post itself. One family can serve all three if it has enough range: weights, italics, small caps, optical sizes.
Literata, originally designed for Google Play Books, has all of that. So the site now runs on one font and two colours. Each element gets its own setting of the same family, and hierarchy comes from size and weight instead of from switching fonts.
For the colors palette, I eventually ended up deciding on Dusky Madder Violet (The text color) on Ivory Buff (The background of the page), beautiful colors with great readability contrast. Paired with the Literata font, it was just perfect for my needs.
Show the code
modes <-data.frame(mode =c("Glance", "Interlude", "Interlude", "Long form"),sample =c("NOV 5, 2026 · 6 MIN READ","Rebranding: Chapter 0","One font, two colours","Each element gets its own setting of the same family."),family =c("literata-500", "literata-800", "literata", "literata"),face =c("plain", "plain", "bold", "plain"),size =c(3.8, 10, 6.5, 4.6),y =c(4, 3, 2.1, 1))ggplot(modes) +geom_text(aes(x =0, y = y, label = mode),hjust =0, size =3.4, family ="literata", fontface ="italic", colour = ink) +geom_text(aes(x =0.2, y = y, label = sample, family = family,fontface = face, size = size),hjust =0, colour = ink) +scale_size_identity() +scale_x_continuous(limits =c(0, 1.25), expand =c(0, 0)) +scale_y_continuous(limits =c(0.5, 4.5)) +labs(title ="Literata, three ways",subtitle ="Labels, titles and headings, and the text you settle into") +theme_bmh()
Figure 3
From there, the rest of the tasks were just housekeeping. Organising, setting up the details, migrating my old files from a hugo-based framework to pure Quarto. It was fun, it took me a whole day to make it work, and essentially it was a fun side quest.